
_______________________________
Guest post by Alexandra Kennedy of the Symphonic BlogIn order to effectively manage your YouTube channel as an artist, it’s important to look beyond the number of views at the bottom of your video when measuring your content’s success.The YouTube Creator Studio has a fantastic dashboard full of useful analytics at your access.We’ve put together our top 7 key video metrics to measure the success of your content on YouTube.
1. Audience Retention
Contrary to popular belief, Audience Retention tends to play a bigger role than Views for video placement in searches and YouTube recommendations. YouTube’s algorithms favor videos that have higher view durations as opposed to a high amount of views with a shorter view duration. In utilizing Audience Retention to measure your videos’ success, take a look at the drop-off point. The drop-off point is when viewers stop watching your video and click away from the content. This will help to determine what parts of your videos make viewers lose interest.A video that does extremely well with this metric would show a straight line throughout most of the graph while being near 100%. This would mean that nearly 100% of your audience viewed your video all the way through. Most times, you will see a gradual decline in the graph. However, any sharp drop-offs or view duration going below 50% is a sign that your content isn’t keeping the interest of the majority of your audience. If this is the case, you may want to re-evaluate your content strategy so that you may improve the retention your next time uploading content.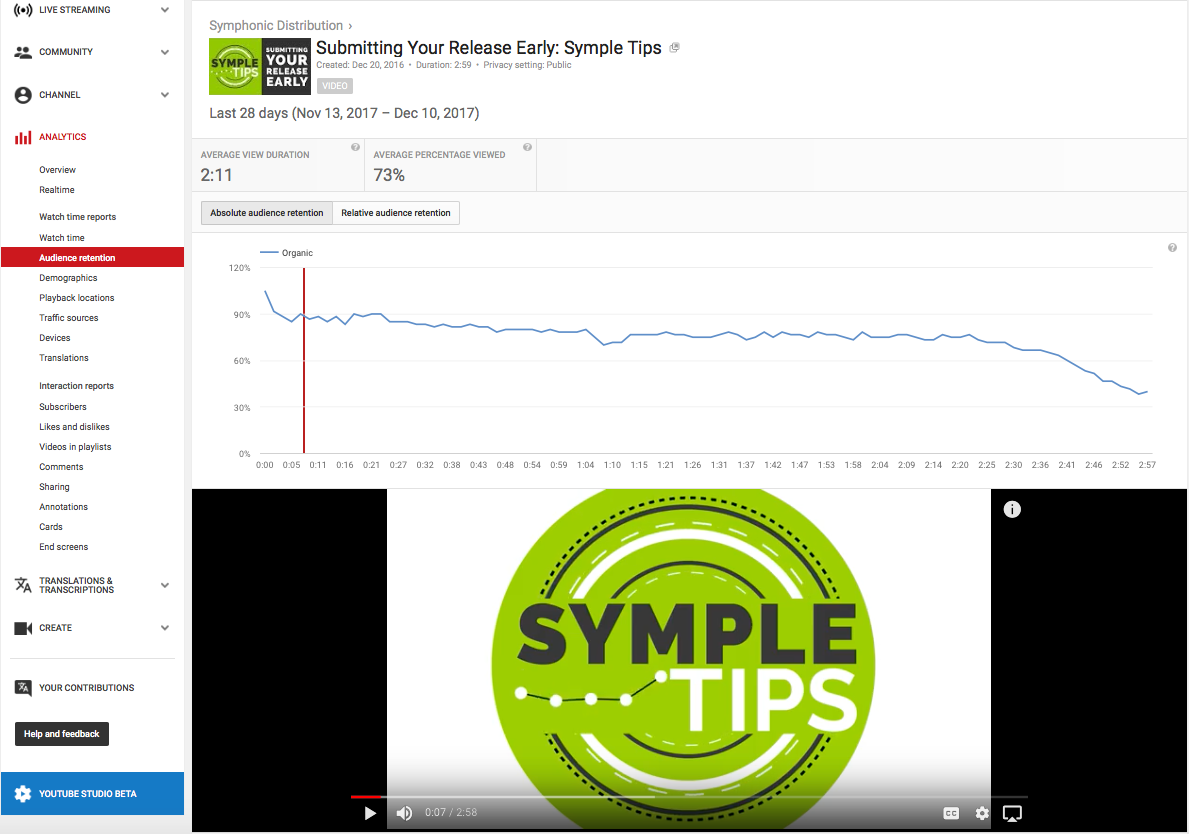
2. Views
Don’t get us wrong, views can be a valuable tool in measuring the success of your videos–if done so effectively. Simply looking at the number amount for a given video doesn’t give much understanding into why your video is doing well or poorly. If you are sharing your video on other platforms, take a look at any spikes in views you may see on certain days in the analytics, while paying attention to the time you made that share. This can give you some valuable insight into what time your audience is most likely to click on your content and give it a watch.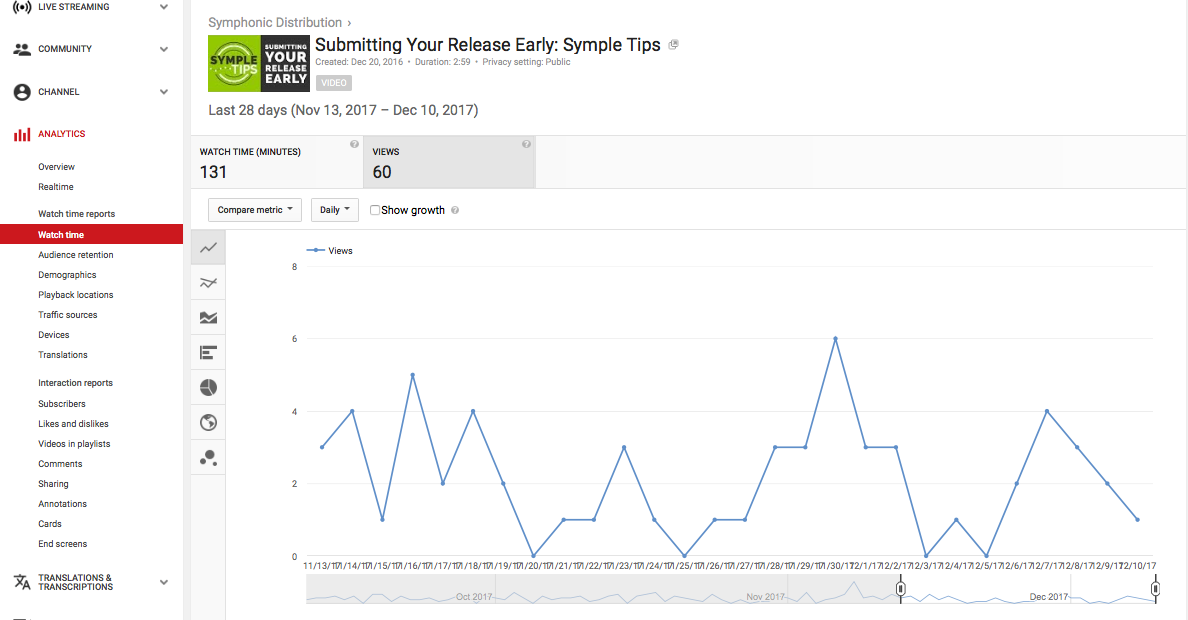
3. Traffic Sources
Checking your traffic sources can give you great insights into where your video gets the most traction by telling you where viewers found your video. If you notice you’re getting the most watch time and views from External sources, this includes the websites and apps that embed your videos or link to your videos on YouTube. This is a good indicator that social sharing on the platforms utilized works well for that particular video. On the other hand, monitoring your Traffic sources within YouTube can give you insights into what aspects of your video may need some additional optimization. For example, if you’re noticing low numbers for browse features, suggested videos, or video cards and annotations, you may want to clean up the backend elements of certain videos. This can include adding tags, making sure your titles and descriptions coincide, and adding that particular video as a card or end screen within other videos.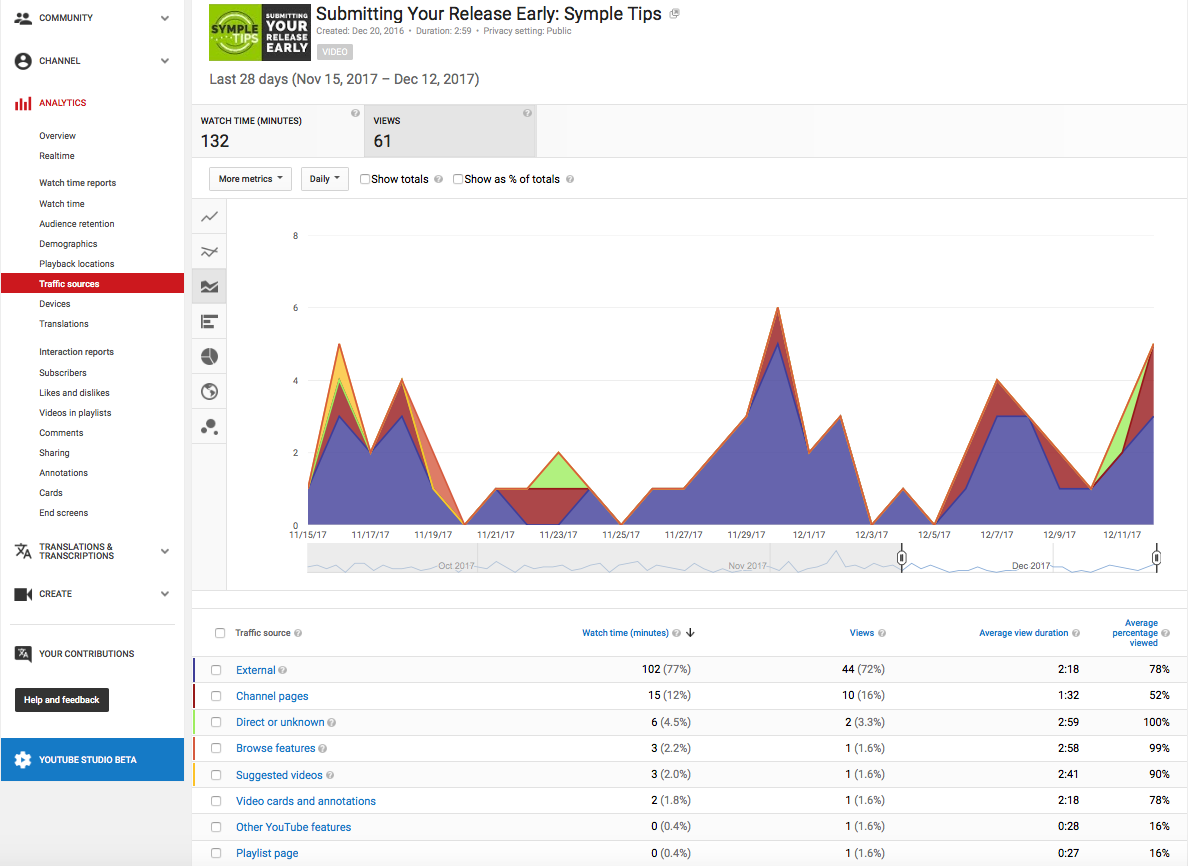 Learn more about Traffic Sources here.
4. Subscribers
What some YouTubers don’t always realize is that you not only have the ability to see how many subscribers you’ve gained or lost, but you’re also able to see the same stats for a particular video. This is one of the most obvious indicators if your video is performing well when viewed by both current subscribers and non-subscribers. If you notice a particular video is gaining you new subscribers, that’s a good indicator that the content in the video is useful to your audience and an asset to your brand and channel. Just as a loss in subscribers due to that particular video can be assessed oppositely.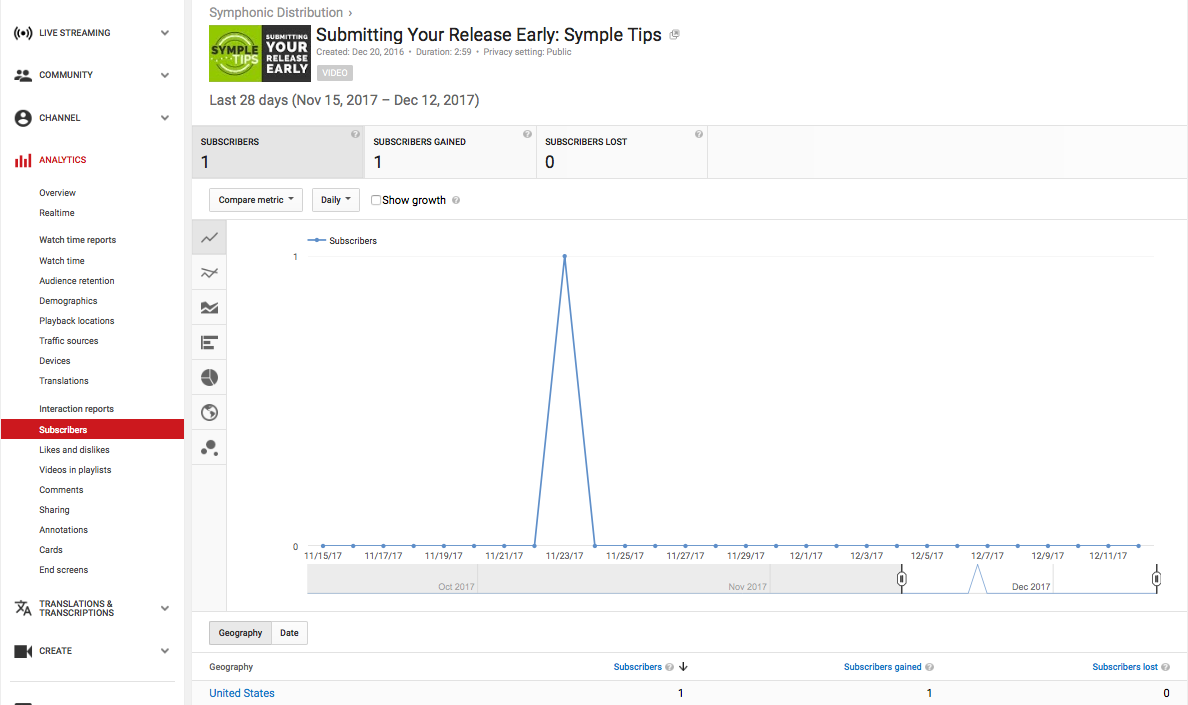 Learn more about the Subscribers report here.
5. Likes and Dislikes
Although likes and dislikes are one of the more obvious metrics that are publicly seen under your videos, it’s helpful to take a look within the Creator Studio to check out the demographics behind them. There you will find the country as well as the device type utilized, which is helpful in further narrowing down your target audience when creating marketing strategies for content.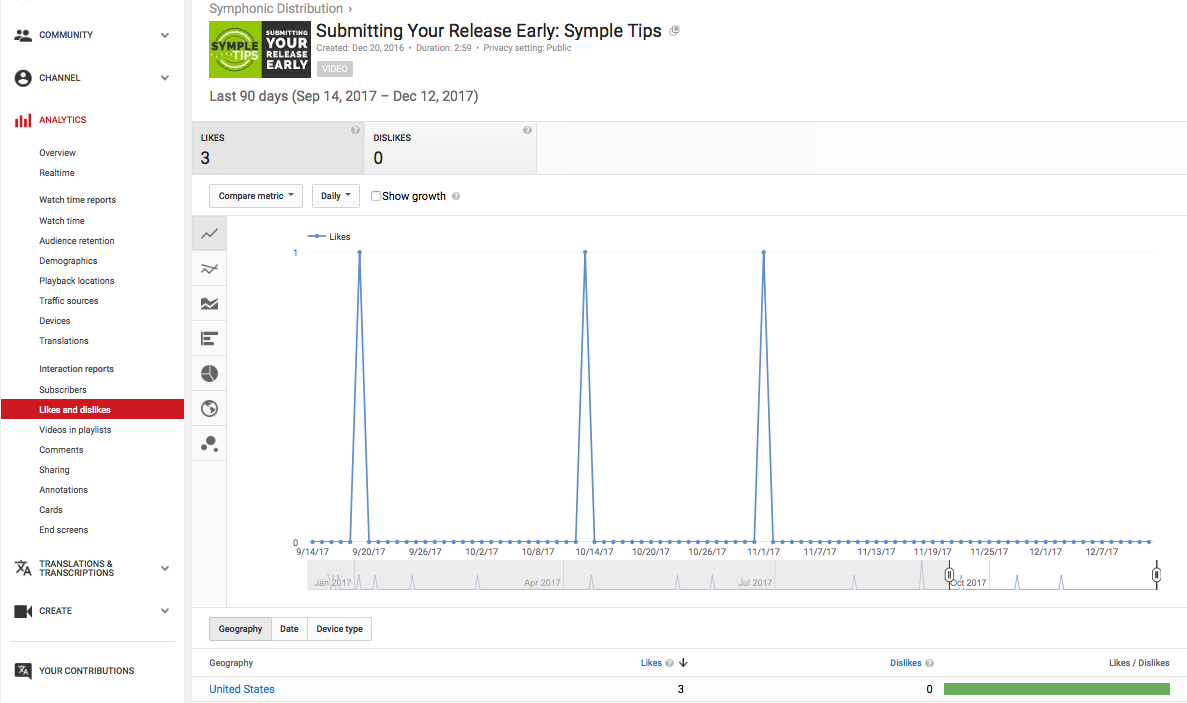
6. Comments
Similar to the Likes and Dislikes, comments are publicly visible and a nice obvious indicator of if viewers feel positively or negatively towards your video. This is a metric that requires a little analysis both publicly and in the Creator Studio. Analyzing the comments themselves allows you to get a real sense of the attitudes of your viewers and from there, it may help guide you to either put out similar content or alter your content depending on the majority reaction. In the Comments report, it informs you of how many comments posted to your video, the date of those comments, and the geography of the user. Although a simple report, it’s another opportunity to gain insight into the demographics of those viewers that value your content.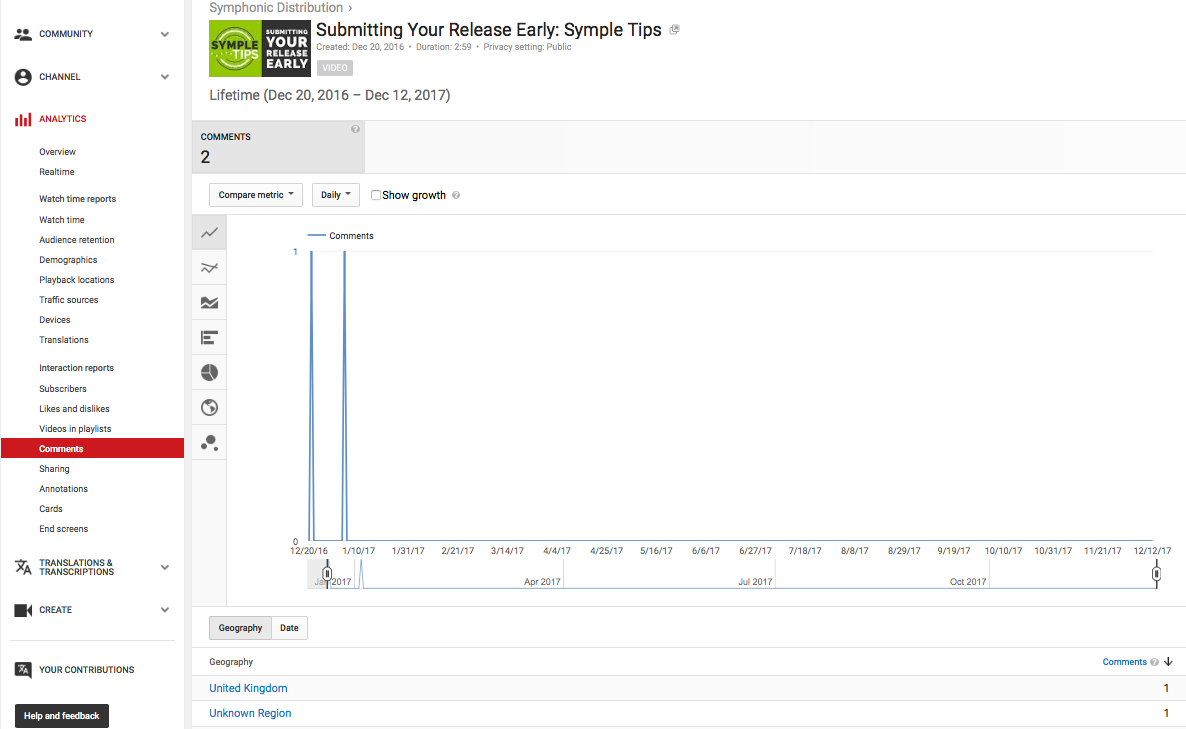
7. Shares
Recognizing how many shares a particular video gets generally shows more insight than the likes, dislikes, and comments combined. When viewers choose to share your video, they are typically making a statement that they really enjoyed the content (with the occasional cases that show to be the opposite). In viewing your Sharing report in the Creator Studio, you’ll be able to see the type of shares from the social media options on the YouTube watch page.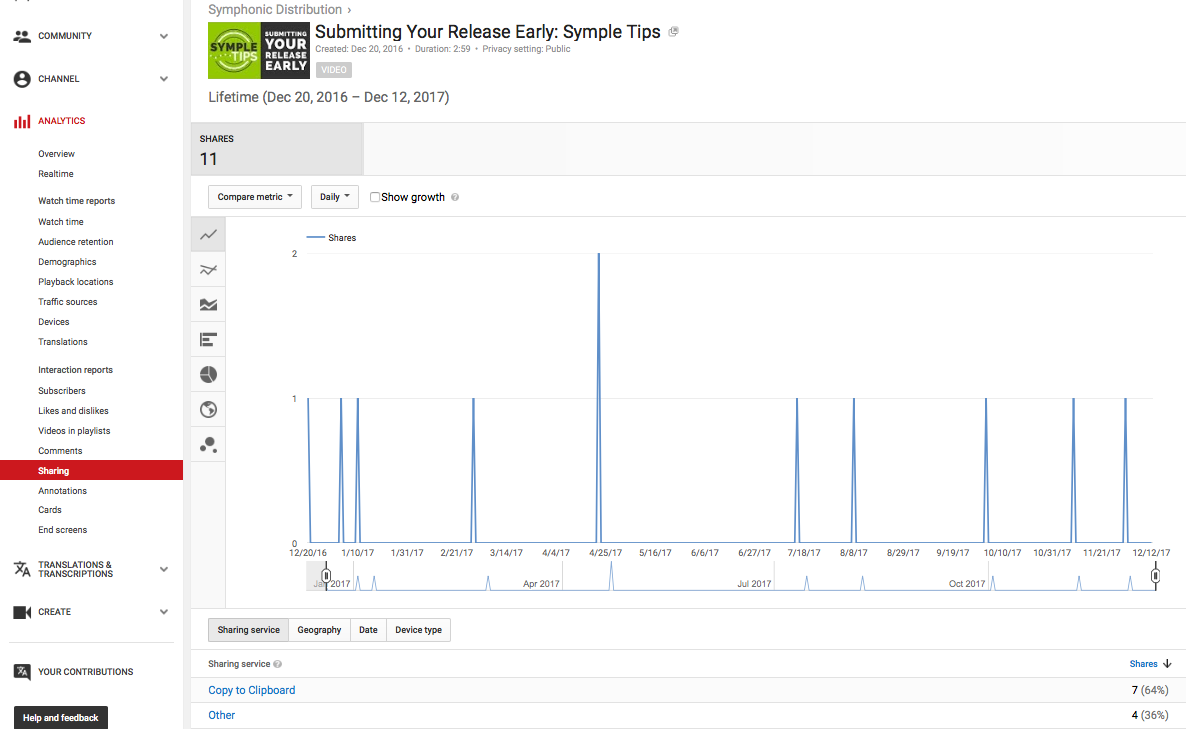 Learn more about the Sharing report here.We hope that with the 7 key metrics described above, you now have the tools to confidently measure the success of your YouTube content now and in the future.