D.I.Y.

Followers vs Listeners: How To Accurately Measuring Attention On Spotify

1In this detailed analysis of listener's playlisting habits on Spotify, we explore the methodology behind the three different types of playlists, and the difference between a Spotify follower and a Spotify listener when it comes to correctly measuring attention on the platform.

________________________

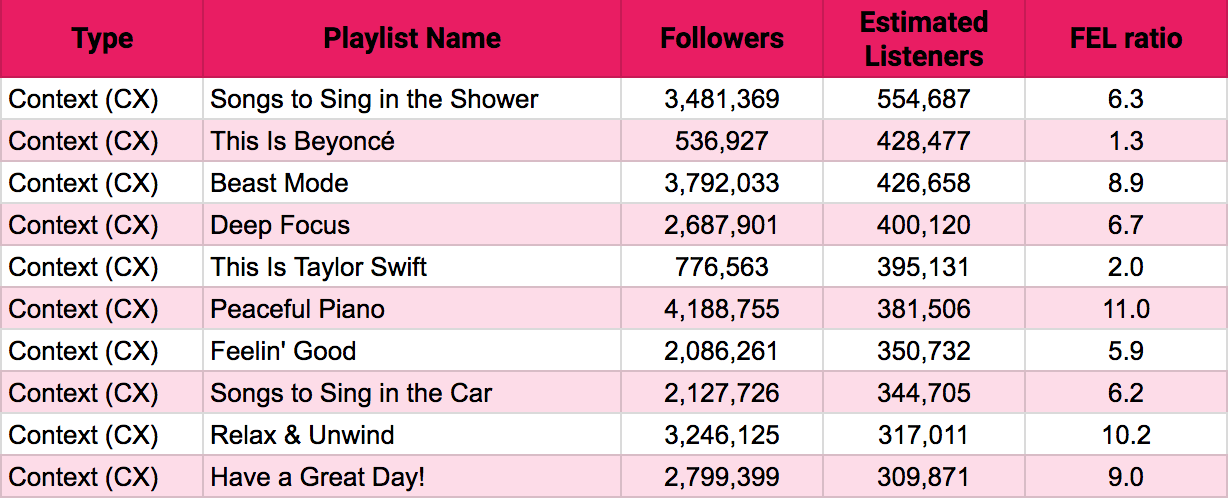
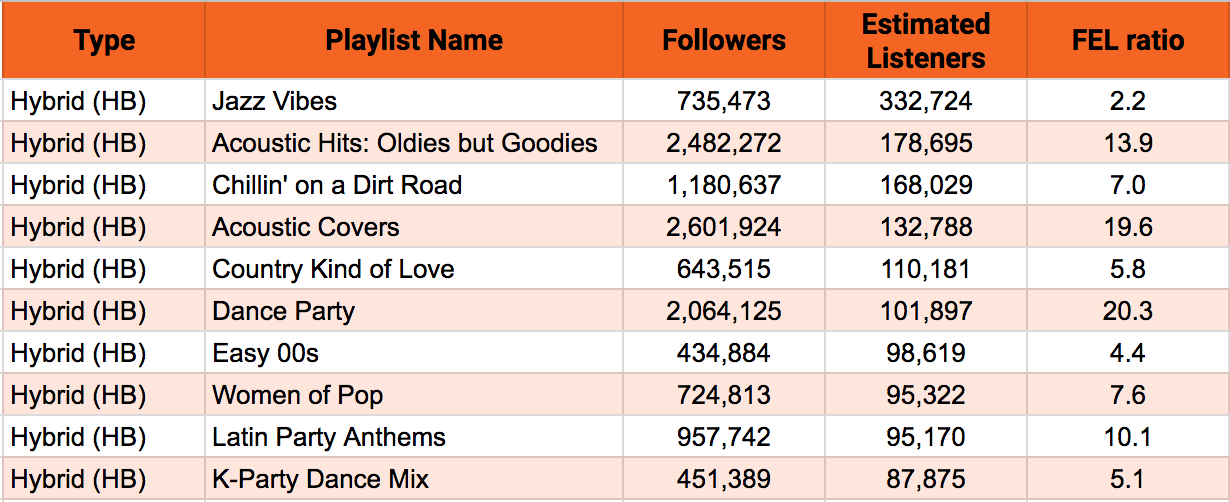
Guest post by Jason Joven of Chart Metric

In March 2018, we explored the idea of content-based (CN), context-based (CX), and hybrid (HB) playlists on the Spotify platform…if you missed it, check it out here for some context (pun fully intended).

But essentially, CN playlists represented the traditional way of categorizing music (e.g., genres, countries), CX playlists focused more on the user (e.g., working out, gaming, day of the week), and HB playlists mixed both types. Of the 950+ playlists at the time from Spotify’s Genres & Moods section of their interface, CN playlists were understandably more plentiful (57%).

More notably, CX and HB playlists outdid them in both median followers per playlist (HB had over 237K follows vs. CN’s 103K) and percentage follower gain since March 2017 (CX had 84% gain vs. CN’s 62%). The evidence pointed towards context being more and more of a meaningful touch point with Spotify users.

In April 2018, we announced a new metric called “Estimated Listeners” (ELs) for playlists. Definitely check it out on your favorite playlist’s Chartmetric profile, and see how we engineer the feature below.

Methodology

“OK…but how are estimated listeners different from followers?” 

991K “Discovered On” listeners from Are & Be, for SZA.

Spotify followers (much like YouTube subscribers) are a vote of long-term confidence in you if you’re an artist. It’s someone in the Spotify community raising their hand and saying “Hey! You’re awesome and I want to hear more from you.” Your content will show up more in that user’s Home/Browse windows, trigger user notification/alerts, and influence other algorithms (e.g., radio stations, Release Radar) that ultimately promote your music.

But being the data-oriented company it is, Spotify provides more to sink our teeth into. Check out SZA’s artist profile (currently on Are & Be, the platform’s #8 most followed playlist) and you’ll see her Monthly Listeners (a dynamic total of unique listeners on a rolling 28-day timeframe) along with the Discovered On column on the right. Here, Spotify shares some popular playlists she has been featured on, and more importantly, how many listeners “discovered” her on it.

Now here’s where the detective work comes in, and in full disclosure- we’re not sure how to precisely interpret this. But our research suggests that it is a count of unique listeners who have played at least one track of that artist, from that playlist, within a moving 28-day period.

Simply, a “Discovered On” listener count is an artist’s Monthly Listeners count, filtered by one playlist.

So SZA’s 991K listeners from the Are & Be playlist (pictured above) could fluctuate up or down over time, but to get back to our original point, it’s also a way to indirectly measure actual playlist plays. Spotify only publicly shares playlist follows, but not playlist plays…so while it’s impressive to look at follower counts, we alternatively can look at any playlist’s “Discovered On” listeners, and crunch some numbers. We are assuming that the regular Spotify user will passively play through a playlist and listen to all artists within.

Estimated Listeners = Average (mean) of one or more playlist artists’ “Discovered On” count, collected manually

Thus, by taking as many artists on a certain playlist as is manually possible, we average that to get to our Chartmetric playlist “Estimated Listeners” count. Why average (mean) and not median? Because we also acknowledge that not all users will stream a whole playlist, so by averaging the artists we do have, we attempt to minimize the lop-sided nature of tracks at the top of a playlist getting more plays than the tracks at the bottom. Perfect? Nope. Better than nothing? We think so.

Estimated Listeners vs. Follows

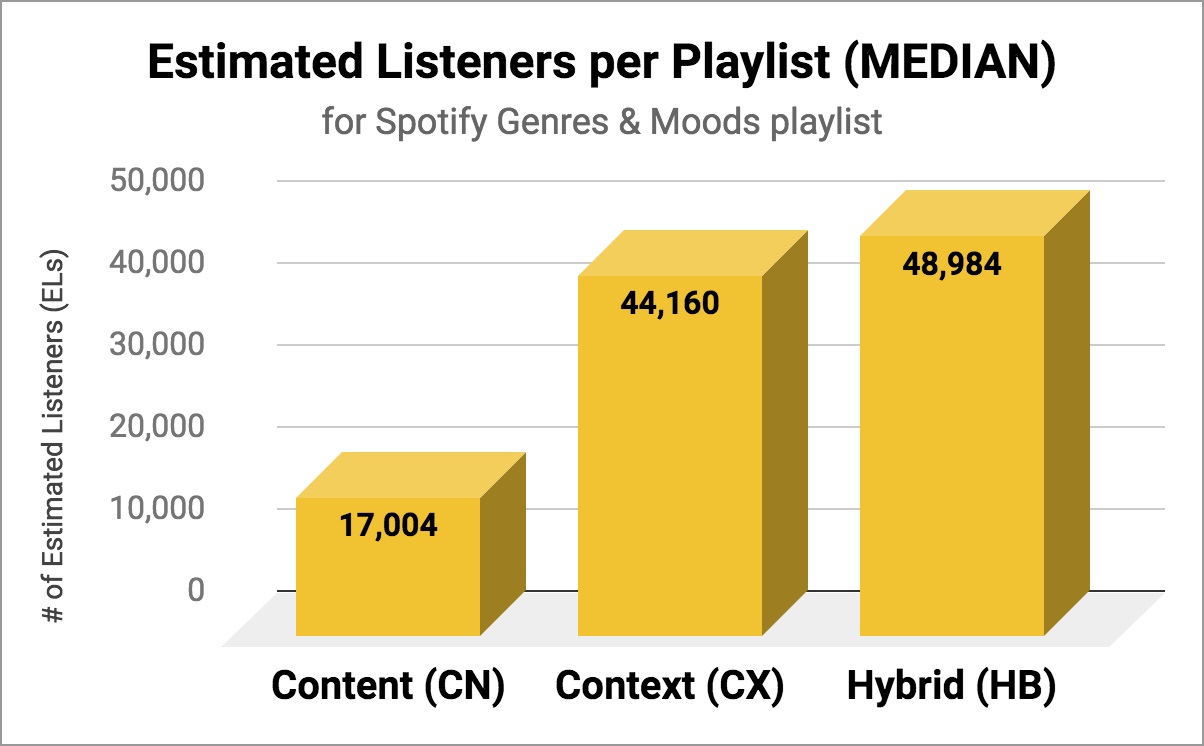
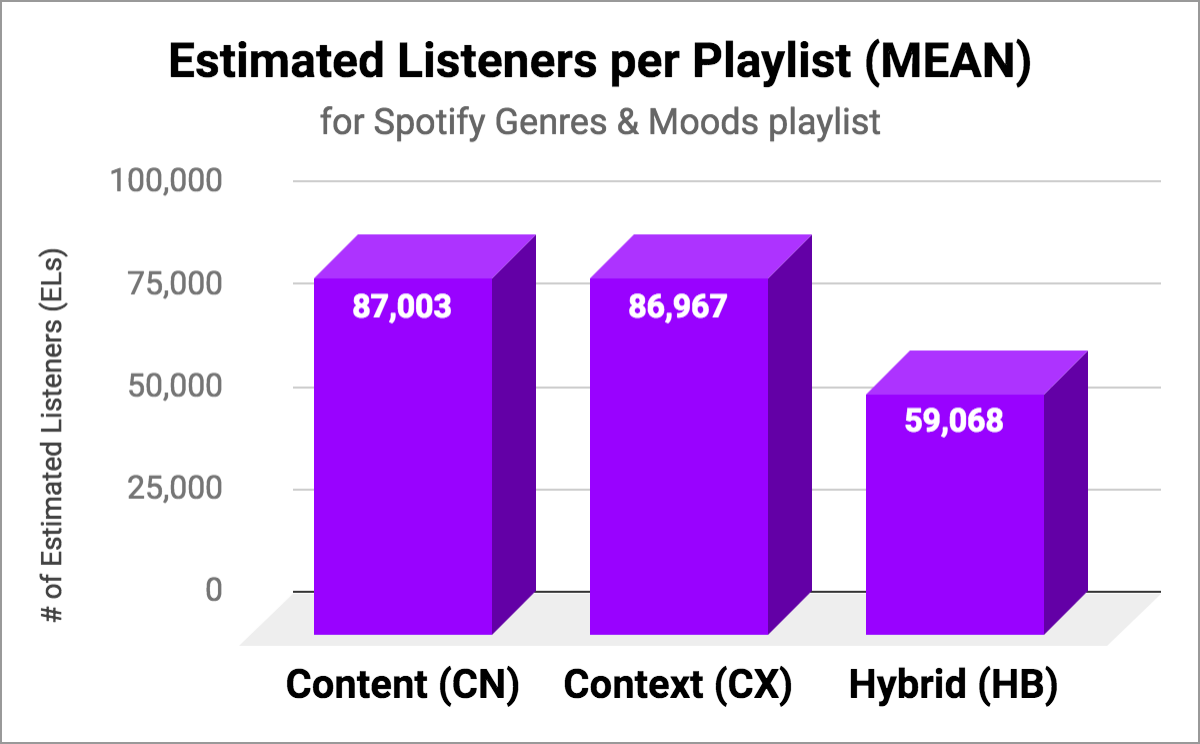
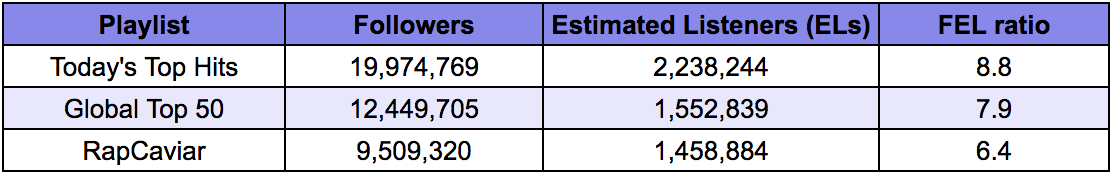
So if we’re using Estimated Listeners as our gauge of playlist “success”, how does it compare to our March 2018 article?

Note we’re still building up this metric in our databases, so of the 973 Spotify Genres & Moods playlists we originally examined, we currently have a reduced sample of 416 playlists with Estimated Listeners.

Additionally, one feature we can now engineer is a Follower-to-Estimated-Listener (FEL) ratio, or playlist followers divided by its estimated listeners. More simply put: “how many say they’ll listen vs. how many actually listen to this playlist?” We’ll come back to this later.

Top 10: Content-based playlists (by estimated listeners)

For CN playlist Top 10, we see Hit Rewind, Rock Classics (now “Rock Anthems”), I Love My ’90s Hip-Hop and This Is Bad Bunny as newcomers, with mint, Rock This, Are & Be, and Get Turnt taking leave. Though all Spotify-curated, it’s notable that we see our first artist-centric Top 10 playlist, with Puerto Rico’s trap/reggaeton star Bad Bunny.

Top 10: Context-based playlists (by estimated listeners)

For CX playlist Top 10, we see more of the same, which is Spotify-owned context playlists like Songs to Sing in the Shower (moving from #3 to the #1 spot). However, the biggest change we see is two more artist-centric “This Is” playlists from both Beyoncé and Taylor Swift, since during our original March 2018 analysis, it was in the context of Women’s History Month (Spotify’s Genres & Moods tag). If we instead consider the next two CX playlists, then we would also find Spotify’s Mood Booster (309.7K ELs) and our first non-Spotify-curated playlist: Disney’s Disney Hits (309.3K ELs) taking their spots.

Top 10: Hybrid playlists (by estimated listeners)

The new HB playlist Top 10 is all Spotify-owned, and notable for less members of the original follower-based Top 10 list (only four: Acoustic Hits, Acoustic Covers, Dance Party, Chillin’ on a Dirt Road). Latin Party Anthems and K-Party Dance Mix are also two new playlists that bring more regional diversity to the mix.

Note that when sorting by EL count, the follower count fluctuates much more with CX and HB playlists. With our traditional CN playlists, they tend to descend more predictably as they include Spotify’s most popular lists. We’ll see this more later.

Unfortunately, we can’t generate a Follower Gain chart like we did in March 2018’s article, as we just started engineering this feature. But the Estimated Listeners per Playlist (by median) recalls our original findings:

Playlist categories remain in the same order, but CX playlists close the gap on HB (by MEDIAN).

By median, HB playlists lead by Estimated Listeners at ~49K, with CX and CN categories coming in at #2 and #3 respectively. This seems to confirm our March results by Follower count. Note CX playlists play a much closer #2 at ~44K this time around.

However, playlist categories flip by mean- suggesting lopsided top performers for CN.

When calculating average ELs by mean however, the order completely flips: CN playlists lead the pack at 87K estimated listeners while HB lags behind at 59K. CX again plays the #2 spot, but is now a virtual #1 tie just under 87K.

This re-ordering makes sense, as mean calculations don’t compensate for extreme outliers like content-based playlists like Today’s Top Hits or RapCaviar. Like we discovered back in March’s article, CX and HB playlists are still establishing themselves with listeners and simply cannot compete toe-to-toe with Spotify’s biggest lists…for now.

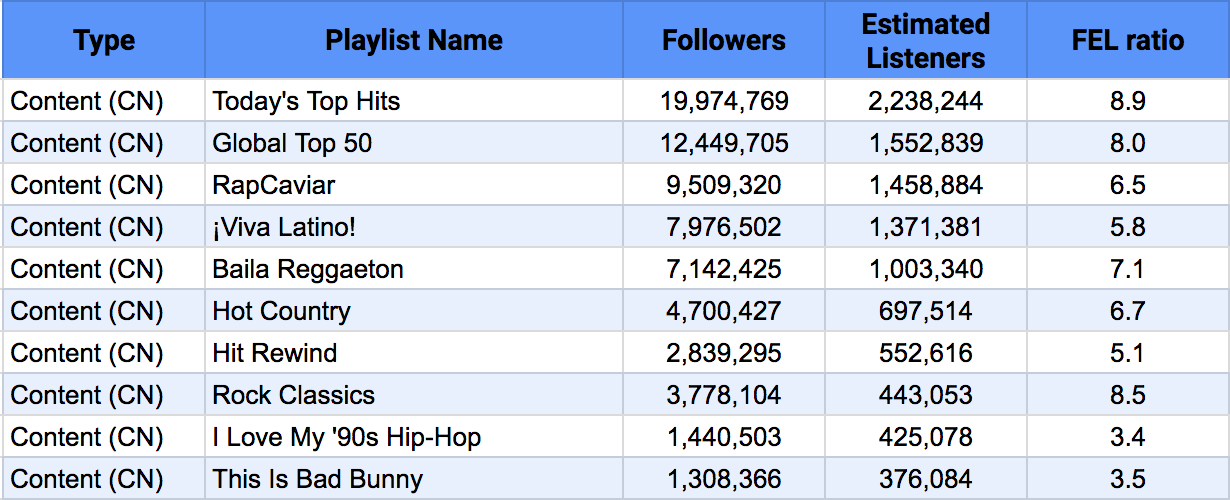
A New Playlist Engagement Metric?

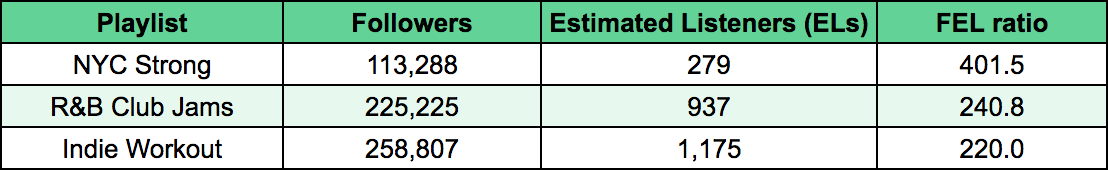
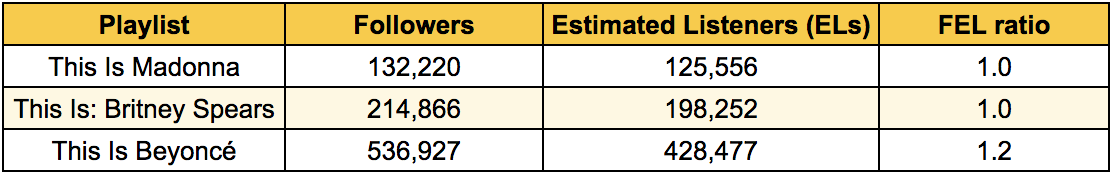
One last point: we believe the Follower-to-Estimated-Listener (FEL) ratiocould be a meaningful playlist engagement metric moving forward. Across all categories, with relatively little variation, the mean FEL ratio is 18.5 and the median FEL ratio is 10.2.

Its inverse relationship with actual streaming should be made clear: the lower the FEL ratio is, the higher the engagement. A FEL ratio of 1.0 would be exemplary- a perfect 1:1 correlation saying “all followers all listen to this playlist”. A high ratio suggests that the list may seem a great idea at first to listeners, but they tend to forget about it later.
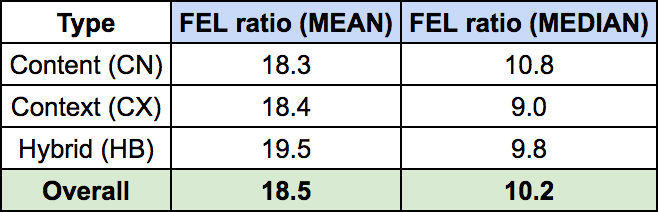
Follower to Estimated Listener (FEL) Ratios: a new engagement metric?

Certainly, one can listen without following, but followers almost always outnumber their EL count.

What could this mean? That, very generally speakingany Spotify playlist’s follower count could be divided by 10 and assume that roughly equals the amount of actual listeners…of course, as a rule of thumb.

Top 3 popular playlists & their FEL ratios

For example, if we look at our usual Top 3 suspects: Today’s Top Hits, Global Top 50, and RapCaviar, their ratios range from 6.4–8.8, meaning if you divide their follower counts by these numbers, you arrive at their estimated listeners. Are the ratios exactly 10? Of course not, but these are also the most popular Spotify playlists in the ecosystem, so they naturally will have a better (lower) FEL ratio.

To be sure, there is a wide range of ratios:

“Worst” 3 FEL ratios: Playlists that seem great at first, but aren’t listened to

Take the three “worst” FEL ratios in our dataset (all context-based): NYC Strong, R&B Club Jams, and Indie Workout…while more work could be done on the possible takeaways, we can speculate.

NYC Strong was Spotify’s playlist response to the Nov 2017 New York City truck attack that caused multiple casualties. Alicia Keys’ “Empire State of Mind” and Beastie Boys’ “No Sleep Till Brooklyn” make up a star-studded playlist honoring the Big Apple, and the desire to be united initially caused its 100K+ follower count…but who wants to return to such a painful memory? Or from a bigger perspective, who remembers to return to an event-based playlist, unless it’s extraordinarily good?

Or consider Spotify’s Indie Workout with over 258K followers and only 1K ELs…does indie exercise music seem like a good idea at first, but in practice, just happen to be really terrible workout music? Or for that genre’s demographic, are they likely to buy a gym membership but never actually use it? We’ve all done it :)

“Best” 3 FEL ratios: Playlists that seem great at first…and are actually streamed!

Interestingly, the “best” FEL ratios (all content-based) revealed mega stars that also happened to be female: the “This Is” playlists for Madonna, Britney Spears, and Beyoncé. This is no coincidence, either: slots #4–6 are Amy Winehouse (1.3), Katy Perry (1.7) and Taylor Swift (1.9). What could this mean? Possibly, that the fans of female A-list artists both show both interest (following) and follow-through (by actually listening).

Such an insight could lead a label or live promotion company to focus on these artists’ demographics for summer tour ticket sales. If the Spotify followers are mostly the same estimated listeners, then these artists’ fan bases would represent a most likely group to purchase concert tickets…at least that’s what the data would suggest!

Share on: