Music Business

Radio In The Time Of Streaming: Chartmetric’s RadioWave Top 300 Data

1As streaming continues to establish itself as the dominant form of music consumption, we're taking a look at the state of radio in 2018, and how American's love affair with listening on the road has helped keep radio alive as a viable portion of the market.

________________________

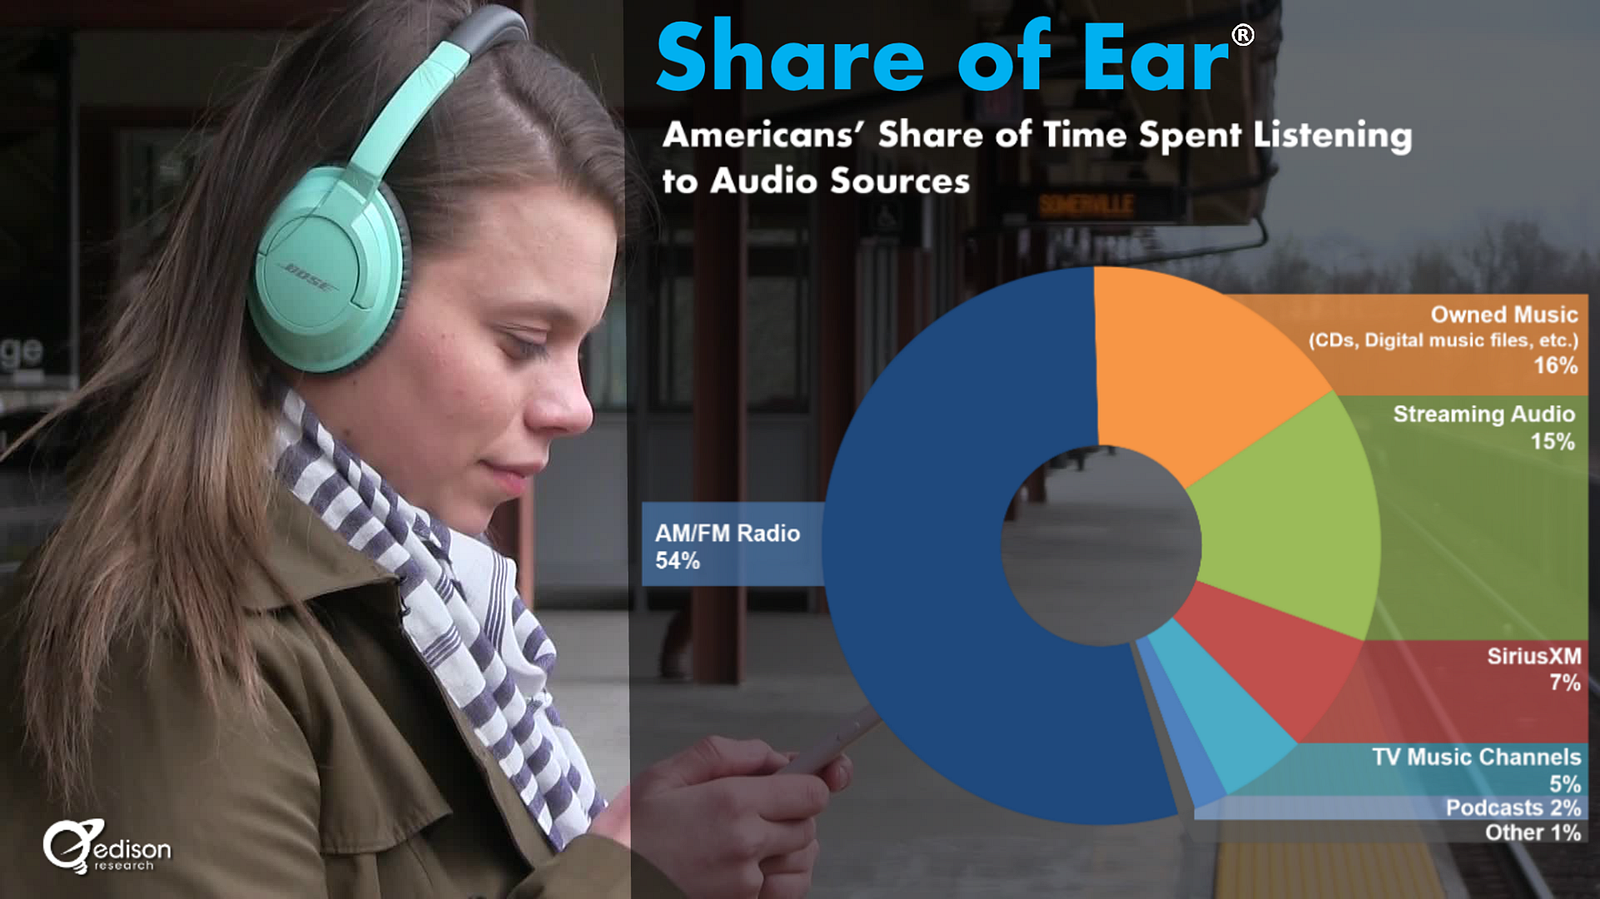
Guest post by Jason Joven of ChartMetric

If you’ve been in the music business for decades, you’ve seen it firsthand: household radio DJ voices giving way to nameless playlist curators. The leisurely FM frequency scan turning into direct, on-demand track selection. Radio promotion teams being turned into playlist pitching ones that more negotiate with mysterious computer algorithms than actual human beings.

News continues to herald the inevitable: iHeartMedia (800+ stations, owner of Mediabasefiled for bankruptcy in March 2018, only months after US radio’s #2 owner/operator Cumulus Media (400+ stations) filed the same in November 2017; US radio continues to draw ire from the global radio community for its practice of paying zero recorded music royalties (also known as “neighboring rights”) to copyright owners, despite making billions in advertising revenue over decades ($15.9B in 2017 alone for traditional US radio ads). The only other non-Rome Convention countries to act similarly: Rwanda, North Korea, Iran, China. Most recently in September 2018, Sirius XM agreed to purchase Pandora Media to the tune of $3B USD, saying something about radio’s reluctant agreement that digital streaming is indeed the future.

Yet in America, record labels are willing to spend $200K-700K+ to break a new artist in a major radio market, according to the IFPI.

Why? Americans LOVE cars.

Edison Research’s Share of Ear study: 70% of US audio consumption happens on four wheels.

Edison Research found that 70% of all US audio consumption (daily average = 4 hrs) happens in the car (versus home, work, etc.) Known for workaholic lifestyles, 77% of Americans drive to work alone, and are presumably looking for some companionship in their morning talk show hosts and singing partners in their favorite artists during their commute.

Edison Research’s Share of Ear study: Americans’ love AM/FM more than streaming

Over half (54%) of this radio consumption comes from AM/FM radio, and when Edison polled in 2011 if Americans used AM/FM in their primary car, 84% said yes. Edison asked again in 2018, and still got 84%.

So if you’re willing to peel your eyes off the hottest Apple Music/Spotify playlist…check out a more comprehensive picture we’ve been working on for you!

Radio spins by artist/track/album over time on Chartmetric’s AirPlay!

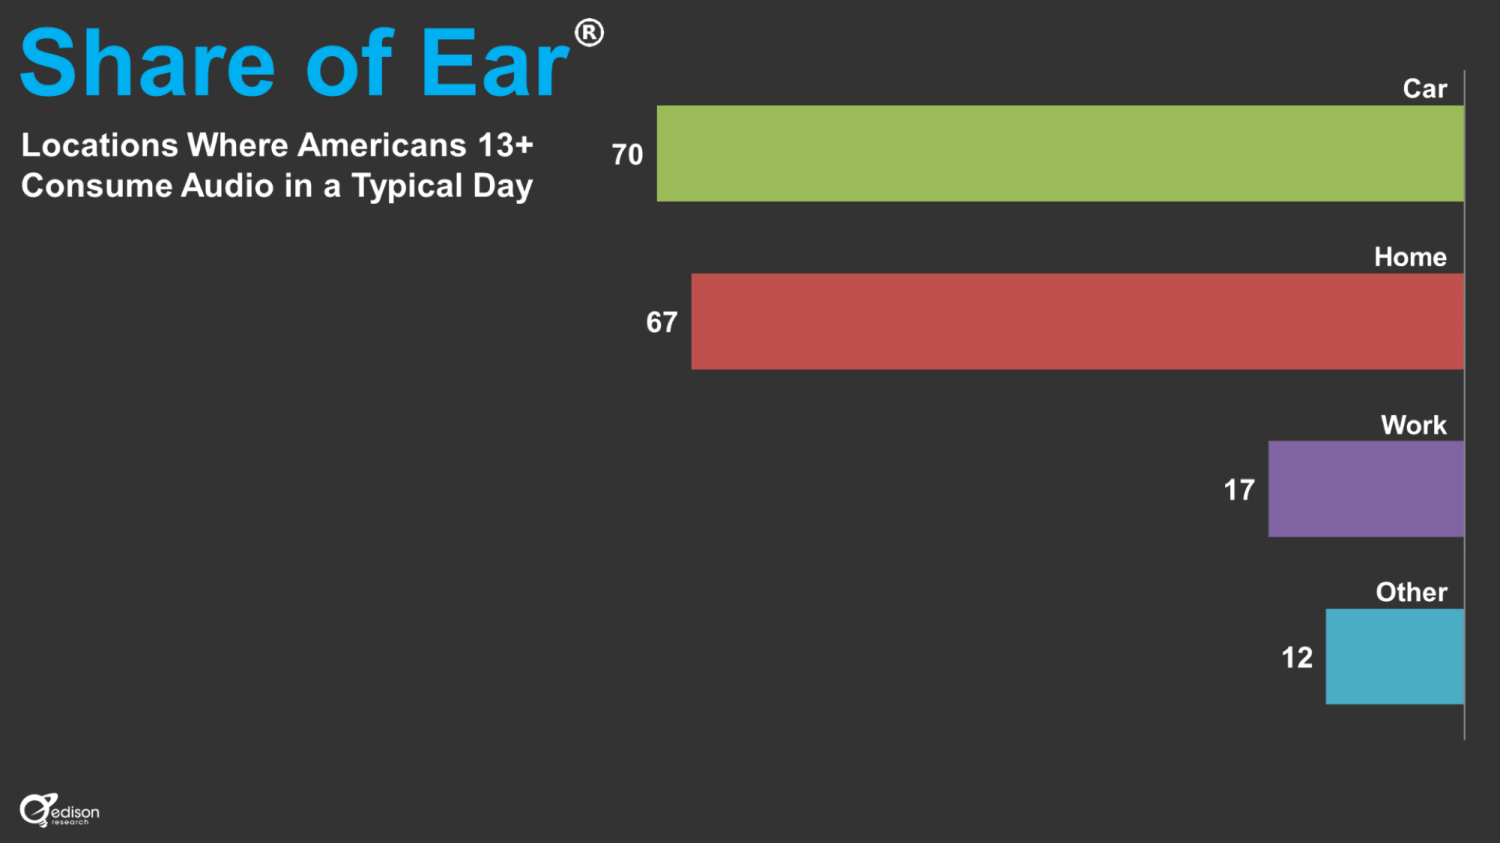
Chartmetric Oct 2018 Update → Radio Spins from RadioWave’s Top 300

While Chartmetric strives to stay ahead of the music analytics curve, we also acknowledge where music’s been and how radio still plays a major role in breaking new artists in the United States. So we’re excited to present our new Radio AirPlay data in all Chartmetric artist/track/album profiles that have terrestrial (plus select satellite/Internet) radio spins in our dataset.

While iHeartMedia’s Mediabase has been an industry standard for monitoring US radio airplay, we’d like to present an easy-to-access tool that sits right alongside the rest of our Chartmetric visualizations. While Mediabase offers a great library of stations, we want to offer a more focused dataset we’re calling the “RadioWave Top 300".

RadioWave, Chartmetric’s radio data partner for AirPlay

Curated by RadioWave, the “first company to electronically monitor 2K+ radio, streaming, video, cable, on demand and satellite music sources”, the RadioWave Top 300 is a select group of the 300 most influential radio stations, dispersed across the United States, and sampled towards the most important broadcast regions for each radio format. It’s more signal, less noise.

First, some radio lingo to brush up on:

Broadcast Market — what you think: the general area that a radio station’s terrestrial antennas reach; many times, a major US city inclusive of many of its outlying towns/suburbs; ERPHAAT and Class are all used to categorize a station’s signal strength and reach

Radio Format — roughly equivalent to genre, but primarily used to determine radio advertising demographics; examples includes familiar terms like “Top 40” but can also include “AAA” (explained below); stations can also flip formats over time

Cumulative (aka “cume)— the total amount of unique listeners for a given time period listening to a radio station for >5 minutes; in terms of audience reach, a very rough parallel to followers of a streaming platform’s playlist

AQH (average quarter-hour persons) — the amount of unique listeners in a 15-minute period listening for >5 minutes; in terms of engagement, a veryrough and much shorter parallel to Spotify’s Monthly Listeners

Daypart — the various slices of the 24-hour day: AM Drive (or “AMD”, 6–10AM), Midday (10AM–3PM), PM Drive ( or “PMD”, 3–7PM), Evening (7PM–12AM) and Overnight (12–6AM); largely focused around the typical American Monday-Friday workday and daily listener patterns

One day of data already tells volumes about radio advertising: the “AM Drive” and quarter hour commercial breaks.

If we look at just one day, there’s two things to note when digesting Chartmetric’s radio data: the importance of the “AM Drive” and quarter-hour commercial breaks. From a larger perspective, during a 24-hour period, the more obvious trend is that big dip from about 5AM to 10AM. As noted above, the AMD is primo radio ad time, and thus, that’s when your artist doesn’t have the best chance of getting heard. But for those who do, you have a great chance at getting that new track stuck in a potential fan’s head all day.

During AMD, people are in their cars and fresh for the day, while PMD is the next most valuable due to the same commute, though people are considered slightly less attentive. You’ll see there is just a hint of a negative bump on the PMD in spin counts, so here’s a great second chance at getting your emerging artists play with less ads to compete with.

As for the smaller hourly trend, notice that between the half-hour gridlines the spin count drops at :15 and :45. It’s clockwork. This is because of how radio stations are rated for listener popularity by Nielsen Audio with devices called Portable People Meters (PPMs).

They measure listeners by fixed quarter hours, but only if they listen by at least 5 minutes (see “cume” and “AQH” above)…so it becomes a timing game. Assuming people tune out for commercials, stations nationwide strategically place ads over each quarter hour, hoping that it will bump up their Nielsen ratings. Good tip next time you’re in the car…

Country is indeed, still strong on the Radiowave Top 300.

Selecting the RadioWave Top 300 stations

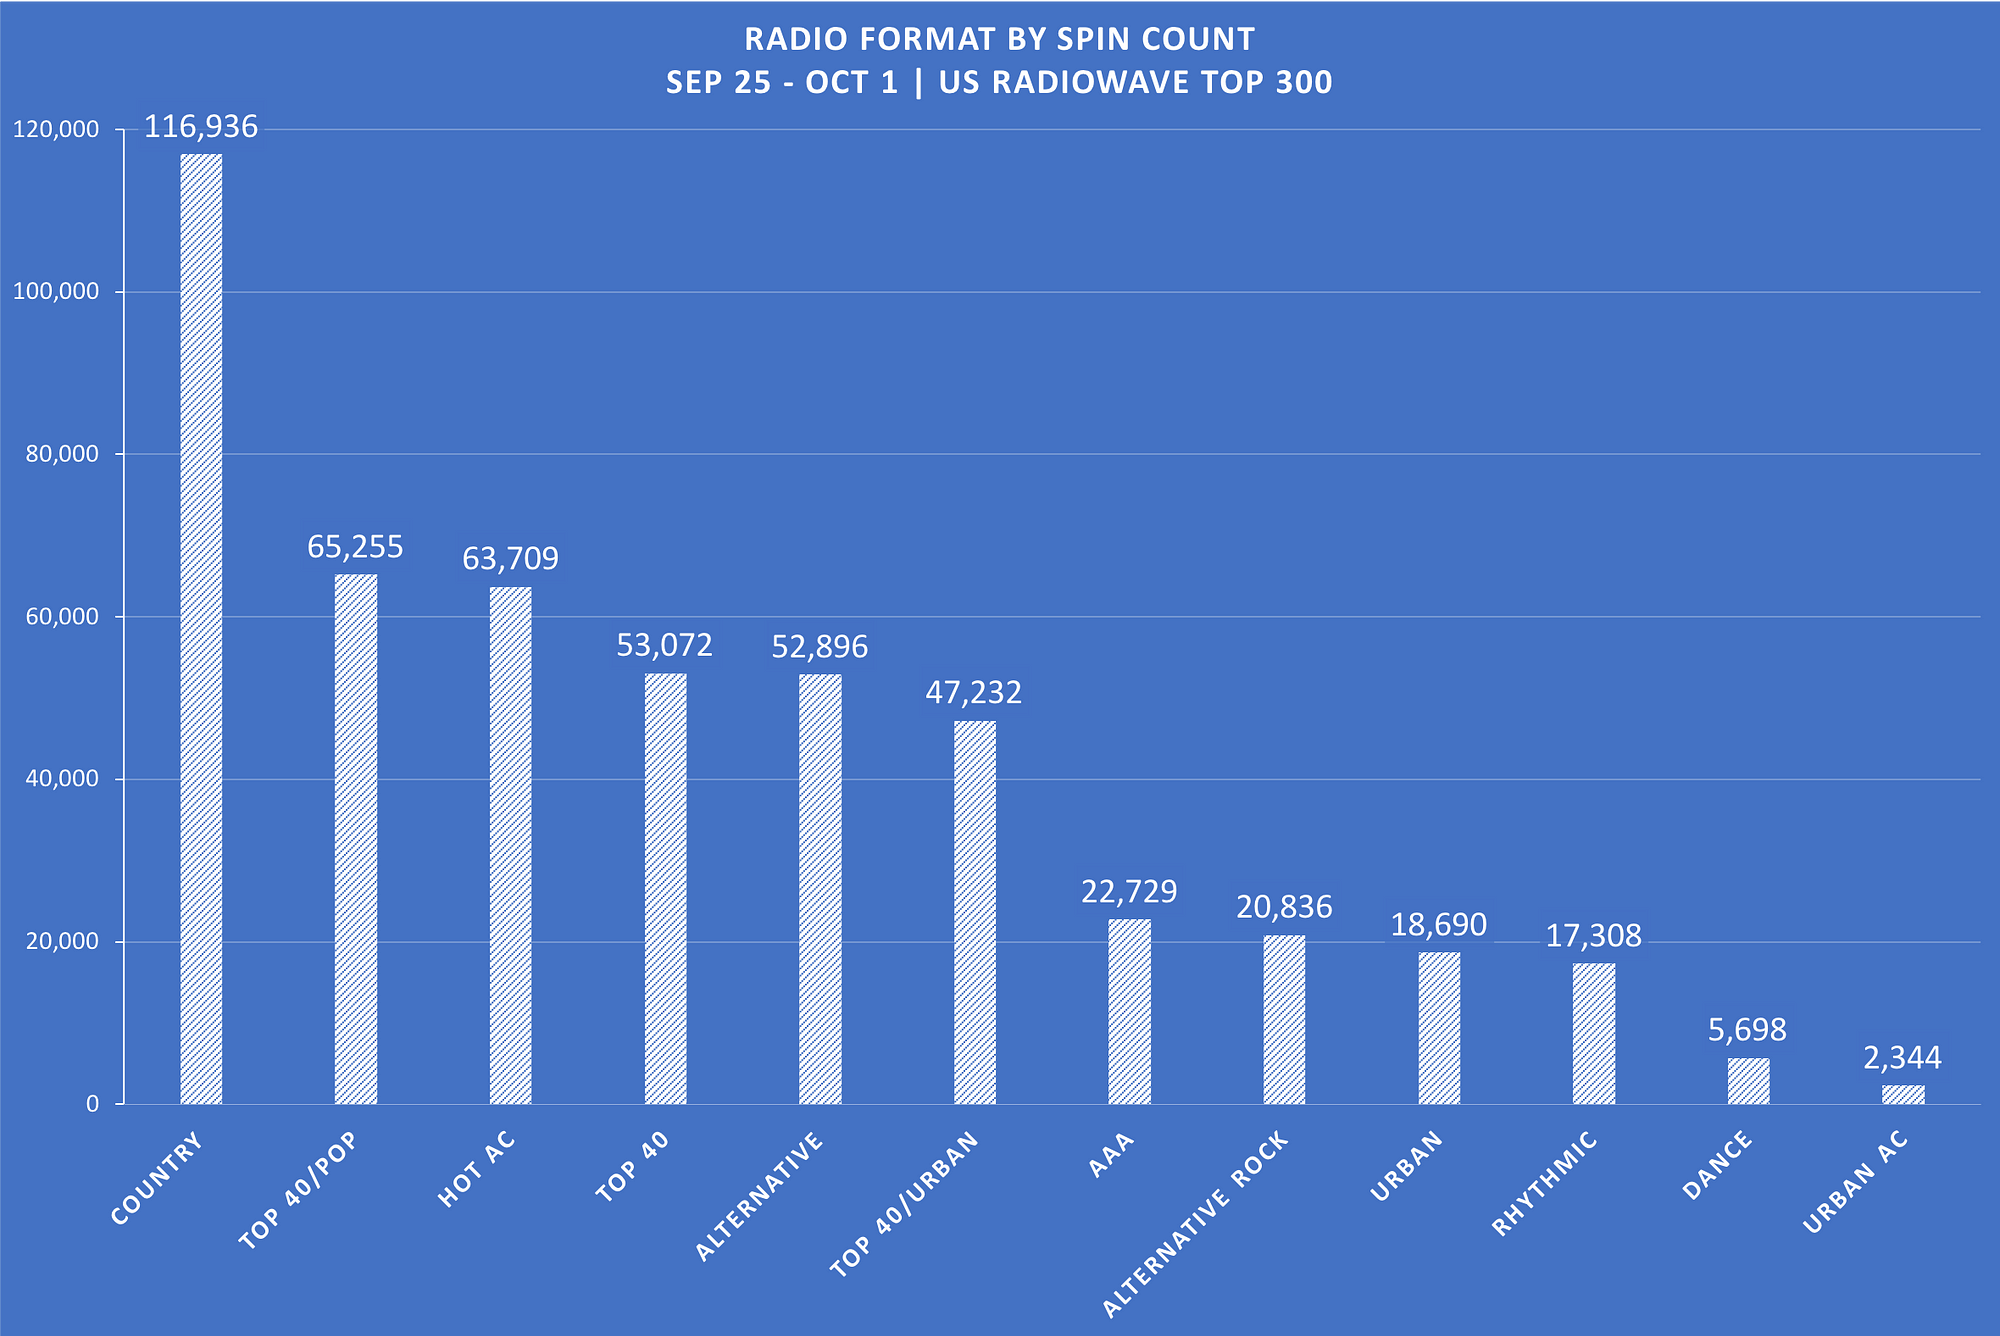
The RadioWave team, led by Seth Keller, worked with us to fine-tune the panel of 300 radio stations, optimizing for the latest new releases from both popular and emerging artists that span the various forms of pop, hip-hop, rock, and country. Essentially, this panel plays what the Chartmetric client base is most concerned about. The radio formats we focus on:

  • AAA: Adult Album Alternative, or “Triple A”; critically-acclaimed music and singer-songwriters, released mostly by independent labels; a smaller format
  • Alternative: Alternative rock; historically, the format started in the West and remains influential there, weaker in the South
  • Country: Plays biggest in the South as expected, but a presence nationwide; by far, the #1 format within our dataset this week (see format table above)
  • Dance: Skews digital (e.g. SoundCloud, YouTube), but Sirius XM does remain a significant influence in this space; the few American stations that do broadcast here can still show early indicators of trends that eventually move into the Top 40 format
  • Hot AC: Hot Adult Contemporary; primarily months-old Top 40 hits, of most concern to major label frontline teams and the catalog teams that will soon inherit them
  • Rhythmic: Plays bigger in the West; a mix of Top 40 and Urban where R&B, dance, hip-hop, pop co-exist
  • Top 40: Contemporary Hit Radio, or “CHR”; what you’d expect, the latest and greatest from mostly major labels
  • Urban: Plays more in the Midwest/South/East; hip-hop and rap

We used quantitative measures like AQH and market area populations in getting a representative sample of what is truly going on via American broadcast. Qualitatively, we fine-tuned by various stations’ influence with artists/executives and their proven ability to break artists/tracks within their various formats. For example, while Nashville obviously plays big in country, Rhythmic plays bigger on the West Coast, and the selection of stations for each genre/format were chosen accordingly.

Top 25 Artists: mostly major label/Top 40 fare, with a few surprises

Brief RadioWave Top 300 Overview

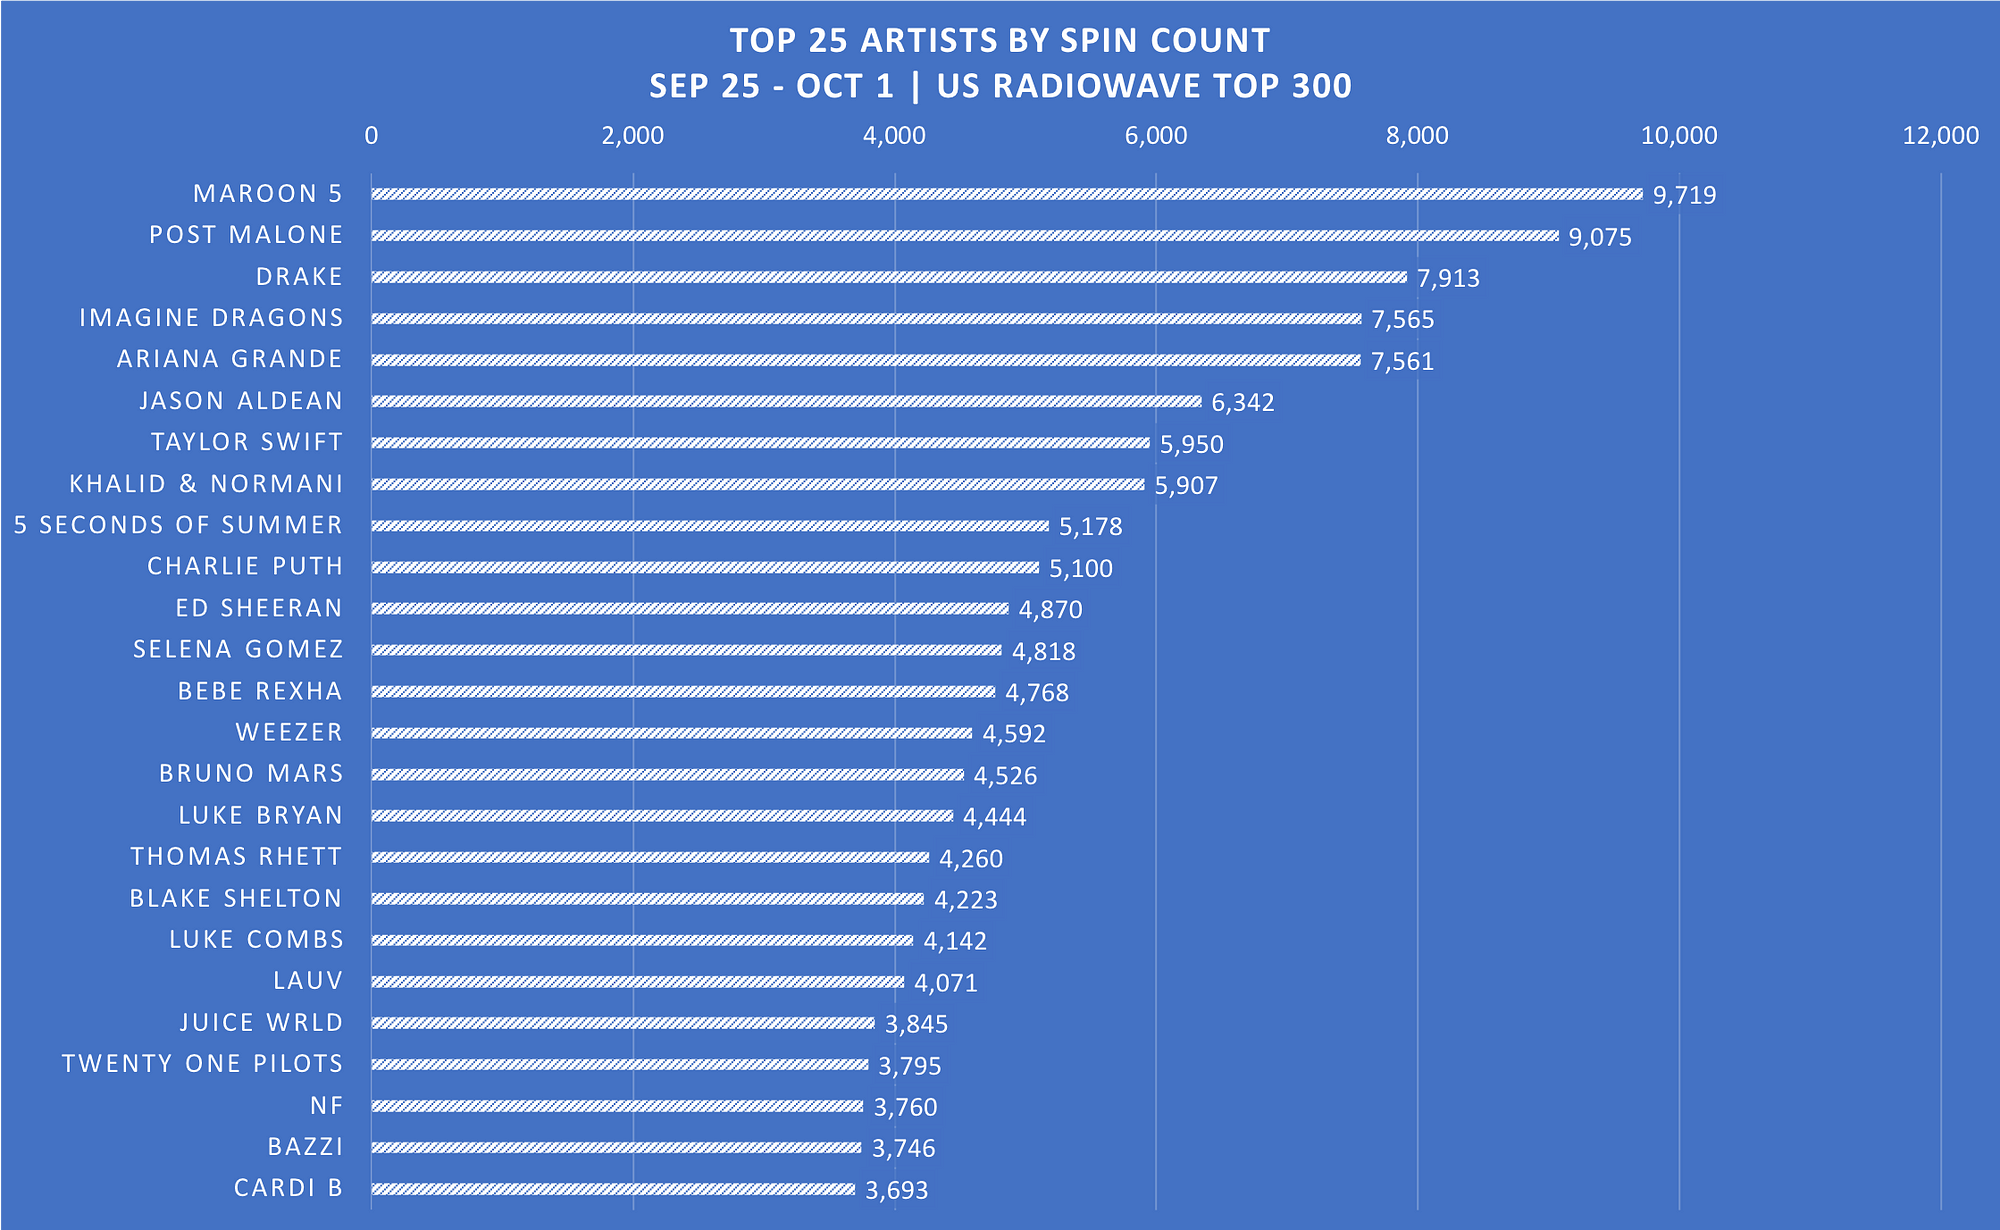
Aggregating all the tracks played in the past week (Sept 25-Oct 1 2018), Maroon 5 and Post Malone are riding high on “Girls Like You” and “Better Now”, respectively. Interestingly, Drake pulls in at #3 despite having no tracks in the Top 15 this past week, but in another way, it shows how deep his repertoire is by not having to rely on any one single to still achieve such radio play stateside.

Despite having the most spins by format, the most spun country artist is Jason Aldean, sliding in at the #6 spot (6.3K), with Luke Bryan (4.4K), Thomas Rhett (4.2K), Blake Shelton (4.2K) and Luke Combs (4.1K) playing strong support roles at #16–19. As a genre, country is showing itself to also have a deep roster of heavy hitters to call upon.

Top 15 Tracks by spin count: more space for independent and DIY artists

Lauv- the sole DIY artist- surprisingly gets the #20 spot (4K), beating out the likes of even Cardi B (3.6K). In the Top 15 tracks of last week, his 16+ month-old hit single “I Like Me Better” apparently has the legs of a marathon runner, managing to still get significant radio play on terrestrial radio waves.

Over time, we‘re excited to see how our radio dataset will evolve.

LEFT: RadioWave spins over time / RIGHT: Top 10 stations by day

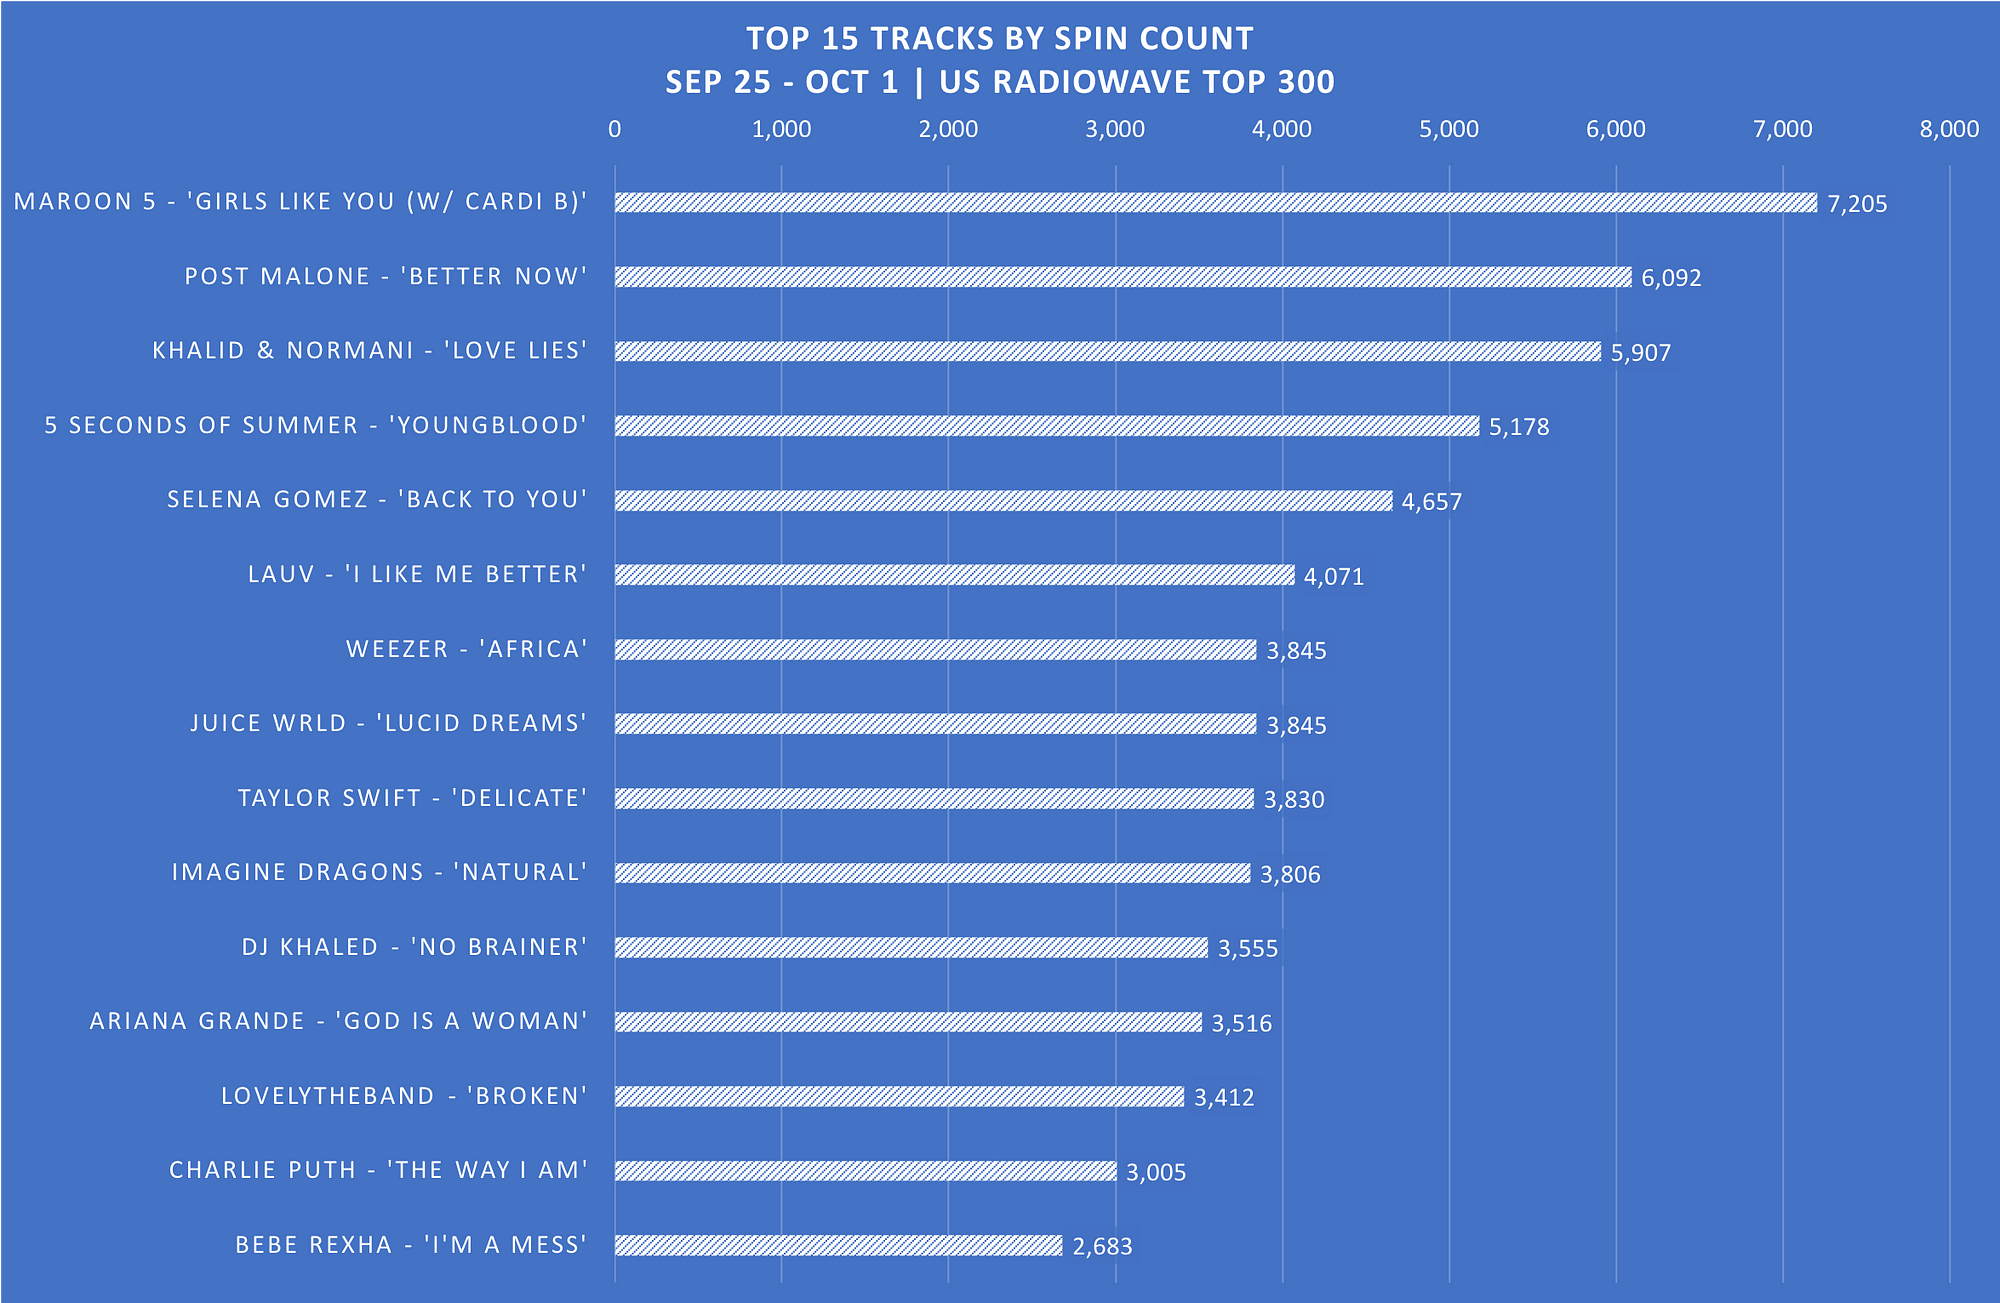
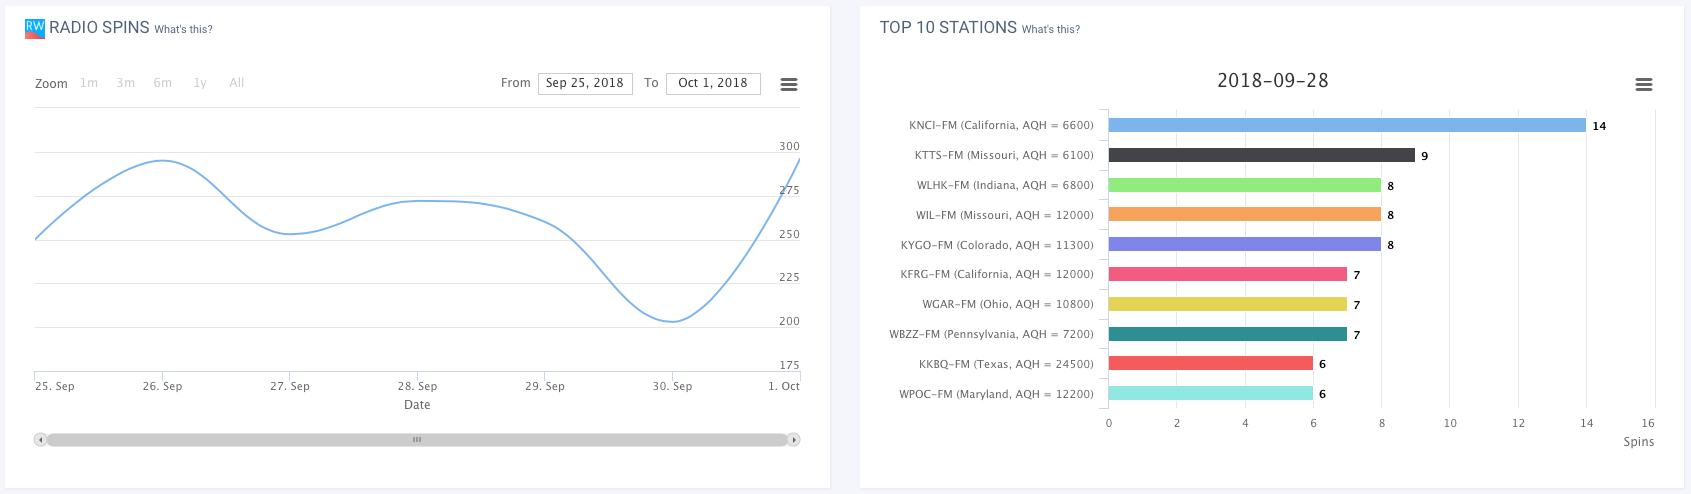
Chartmetric Radio AirPlay Interface

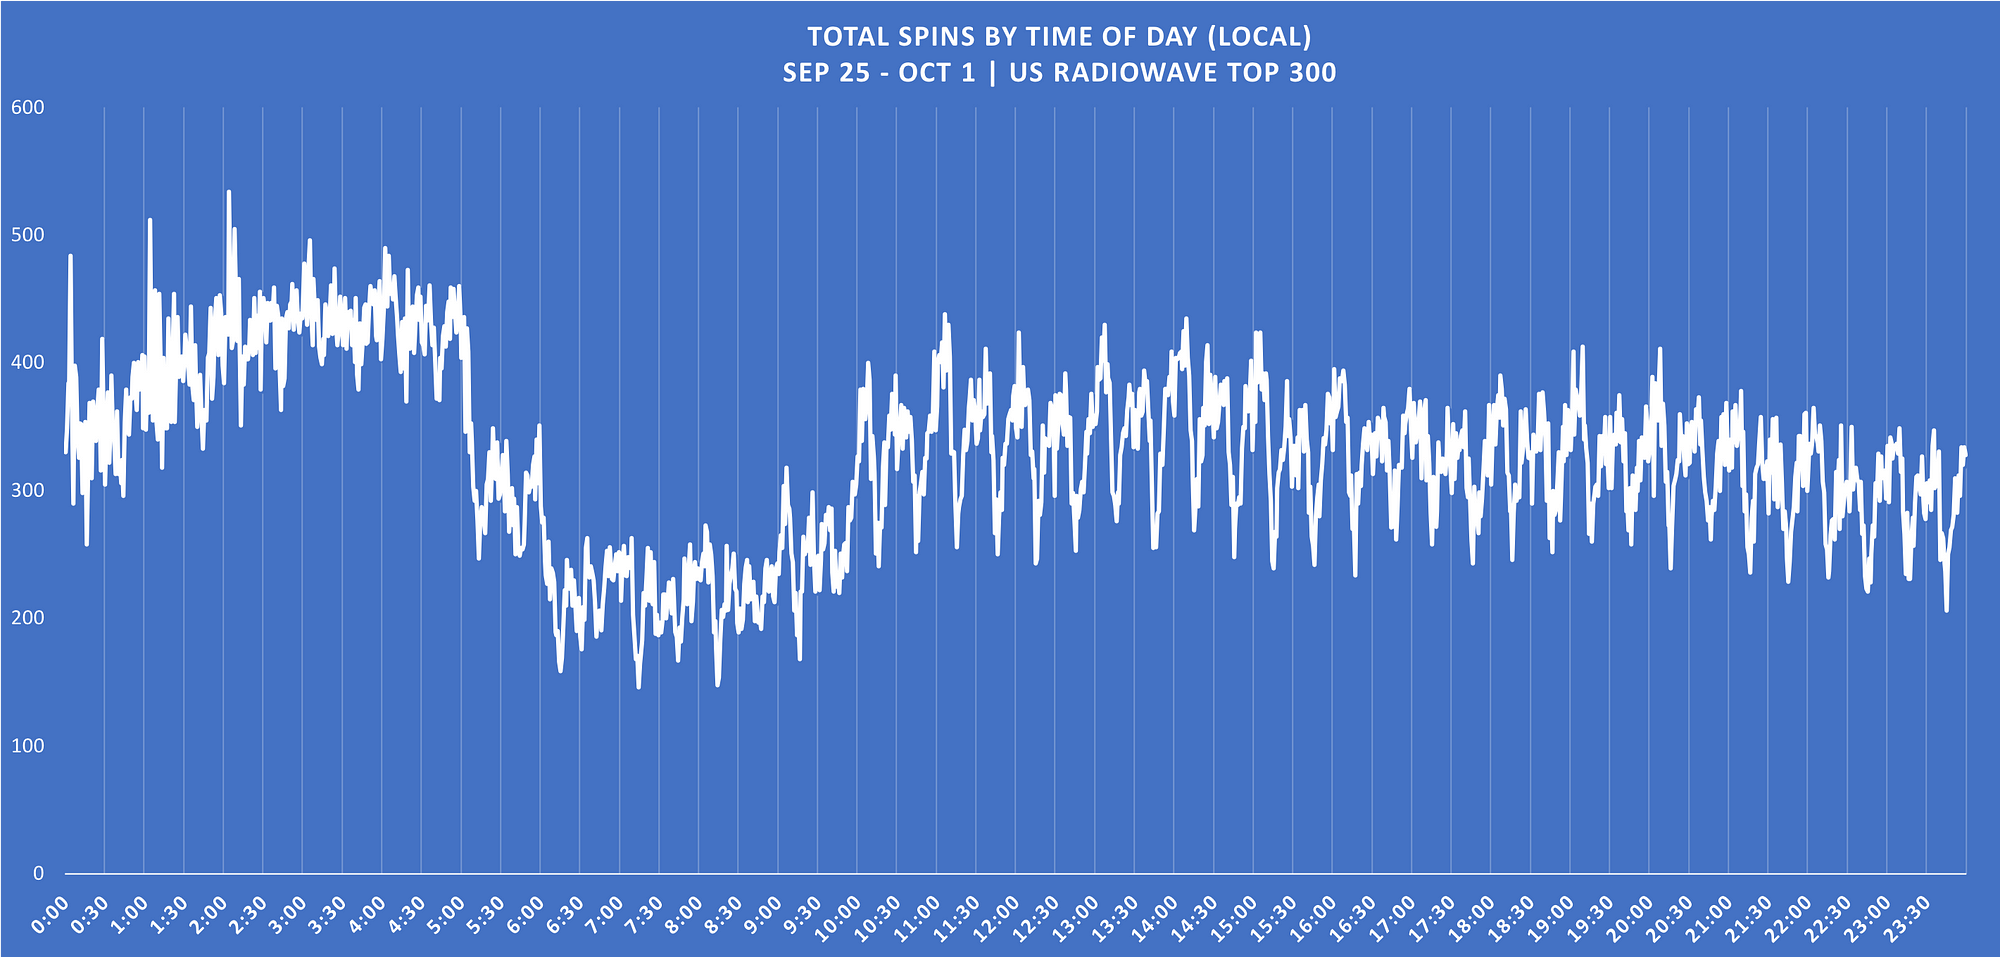
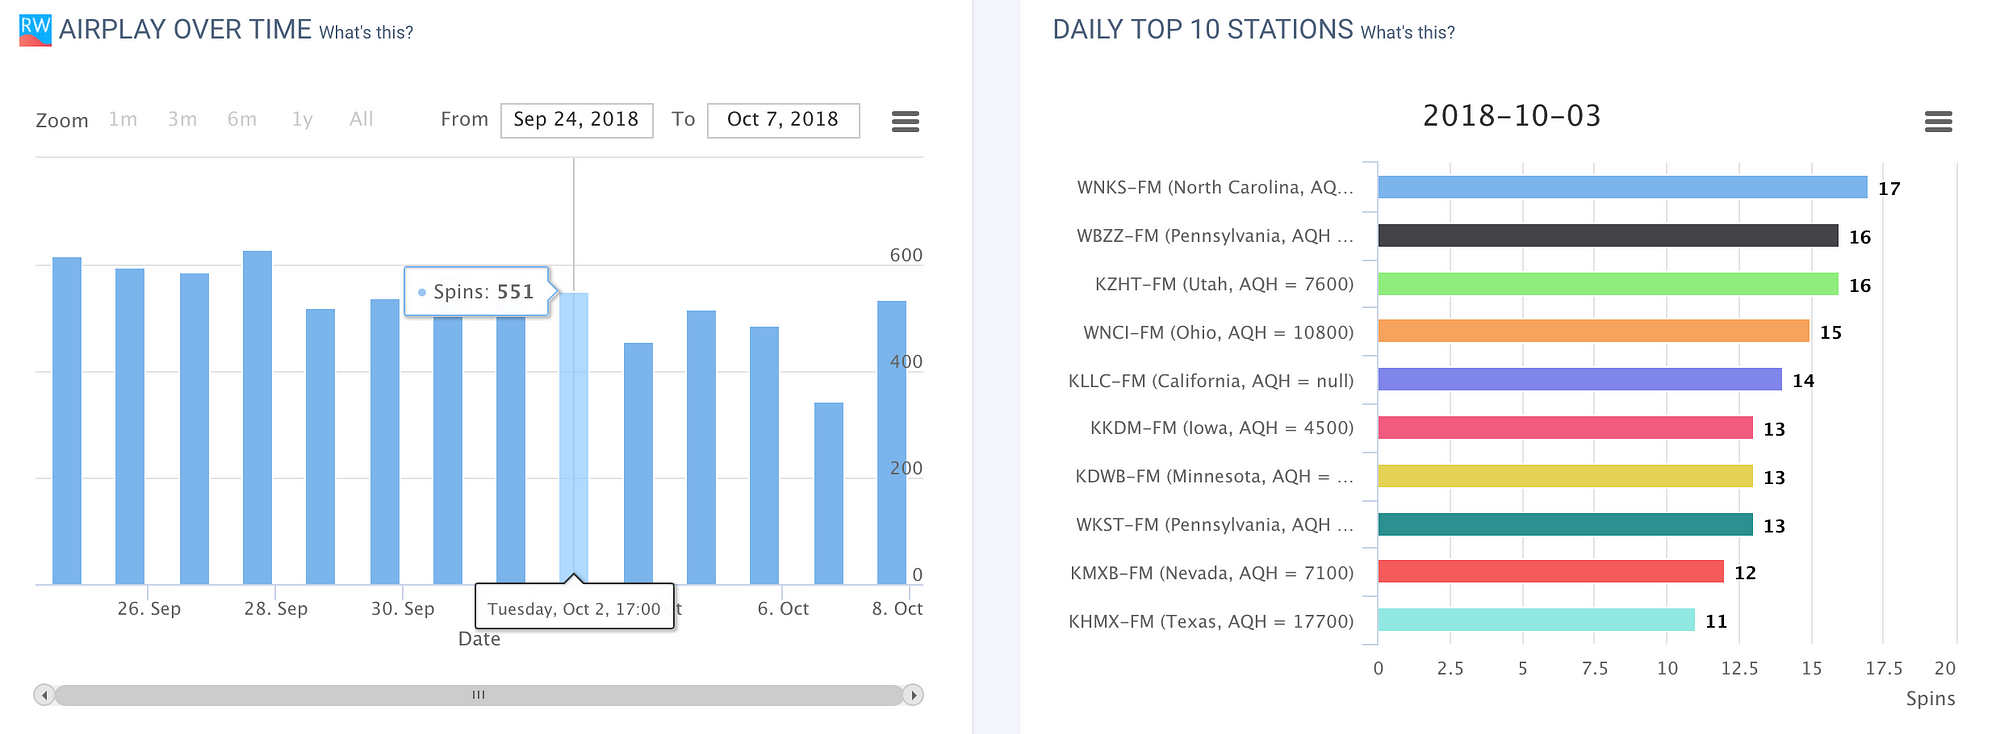
Our first AirPlay charts function much like our Spotify Playlist Evolution ones, in which you can scroll over the aggregate amount of spins on the left line chart over your chosen timeframe (for now, only a week but this will grow) and the right bar chart will dynamically show the top 10 US stations by spins.

By Geographical Market: Spin Count & Market Share (last week)

In the Top Markets (All Time), on the left will be a simple spin aggregation of the RadioWave Top 300 stations by state. On the right, it will be the market share, which will be the total amount of the track/artist/album spins (depending on which page you’re on) divided by the dataset’s total market spins for all time since we began collecting on Sept 25, 2018.

Details section: dynamic search enabled!

Lastly, you can use the Details section here like you have with any of our other pages displaying the more nitty-gritty details, made easier to use by the dynamic search field in the upper-right corner of this section. Feel free to search for station call signs, track titles, markets, or even AQH ratings. The drop-down will give you daily filtering, and CSV export is possible as well.

As our more seasoned users know by now, expect the Chartmetric squad to keep iterating in how we visualize and make the data more useful for you!


Streaming Hasn’t Killed The Radio Star

As Spotify, Apple Music, Google/YouTube, QQ Music, JioMusic-Saavn and countless global players battle over the world’s streaming market…let’s not forget about US radio. Many of us have grown used to (or simply grown up with) thinking “1 play = 1 person”, but with traditional radio, it’s more 1 play for the radio station’s cumulative market listeners, potentially. One radio spincan potentially equal thousands of listeners, so it’s important for us to think differently vice the extremely personal streaming world.

As of IFPI’s 2018 Global Music Report, America remains the #1 music market worldwide, and if your artist wants to break into mainstream US, radio still must be a big piece of your strategy. So while you make master plans with the new Airplay dataset, we’ll continue to find new ways to help you connect with your fans, quickly and accurately.

Apparently, video didn’t kill the radio star…and so far, neither has streaming.


Have any thoughts about radio data? Shoot us a message at hi (at) chartmetric (dot) io!

Share on: