Streaming Breathes New Life Into Older Record Catalogs
 As the rise of the streaming industry continues to alter the ways in which listeners consume music, we're starting to get a better handle on what some of these changes look like. One change that's been a benefit to artists is the revivification of their older work, or "catalogue" material, with more listeners reaching back to "re-discover" older recorded works.
_____________________________
Guest post by Jason Joven of ChartMetric
Since 2014, digital music streaming put on its big boy pants and buoyed the recorded music business into its third year of rising global revenue. As if that weren’t good enough news already, fans found out that their old music- or what industry executives call “catalogue”- mattered again.
In the recorded music business, “frontline” has traditionally been considered any track less than 18 months old. “Catalogue” was any music older than that 18 month period. This distinction- while mostly arbitrary to everyday fans- meant a lot to how money was allocated to a recording artist’s career.
“The new dawn that is set to reshape finances of the recorded music landscape is the international long tail of streaming.” — Denis Simms via Music Business Worldwide
For all the glitz and attention that label marketing dollars throw onto a new frontline artist’s latest release, streaming now muddies its distinction somewhat. There’s less pushing for limited physical retail shelf space in a WalMart or Best Buy, and subsequently less losing your old album favorites at the bottom of your bedroom closet or under your car seat.
In the omnipresent streaming environment…Billy Joel is just as playable as Travis Scott, Ariana Grande as much Guns N’ Roses. So it begs the question: how important is “new”? Will “frontline” records continue to hog both label and fans’ severely limited attention spans, or are “catalogue” records set to explode beyond its “Greatest Hits” limitations?
Chartmetric Feature: Catalogue / Frontline / Add Ratio filtering for Playlists
In an effort to further demystify the playlist landscape, we’re unveiling two new features we hope will be useful for your playlist pitching and market analysis: catalogue and frontline playlist sorting, as well as “28-day add ratios”.
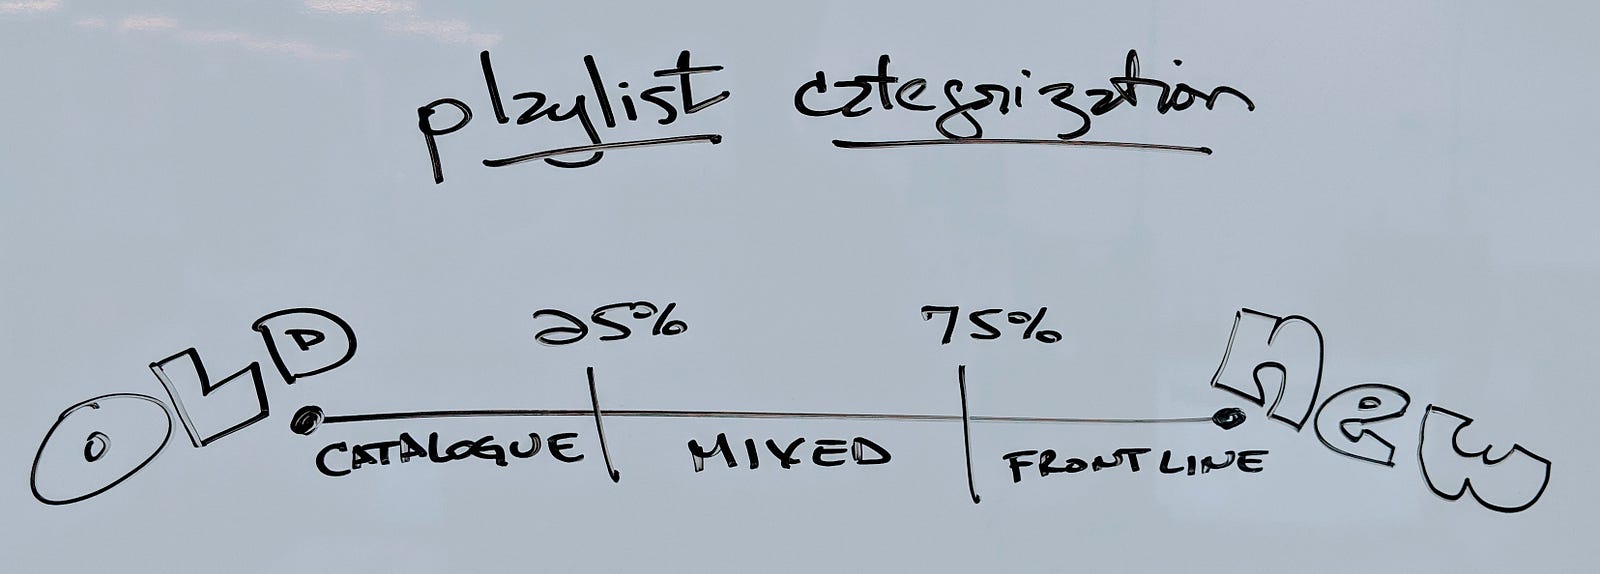
Starting today, Chartmetric users will be able to browse Spotify, Apple Music and Deezer playlists by how many of their tracks are catalogue/frontline. If a playlist’s tracks are 75% or more released within 18 months, we’ll label it “Frontline”. If 25% or less are within that time period, we’ll label it “Catalogue”. If it’s between 25–75% new, then we’ll call it “Mixed”.
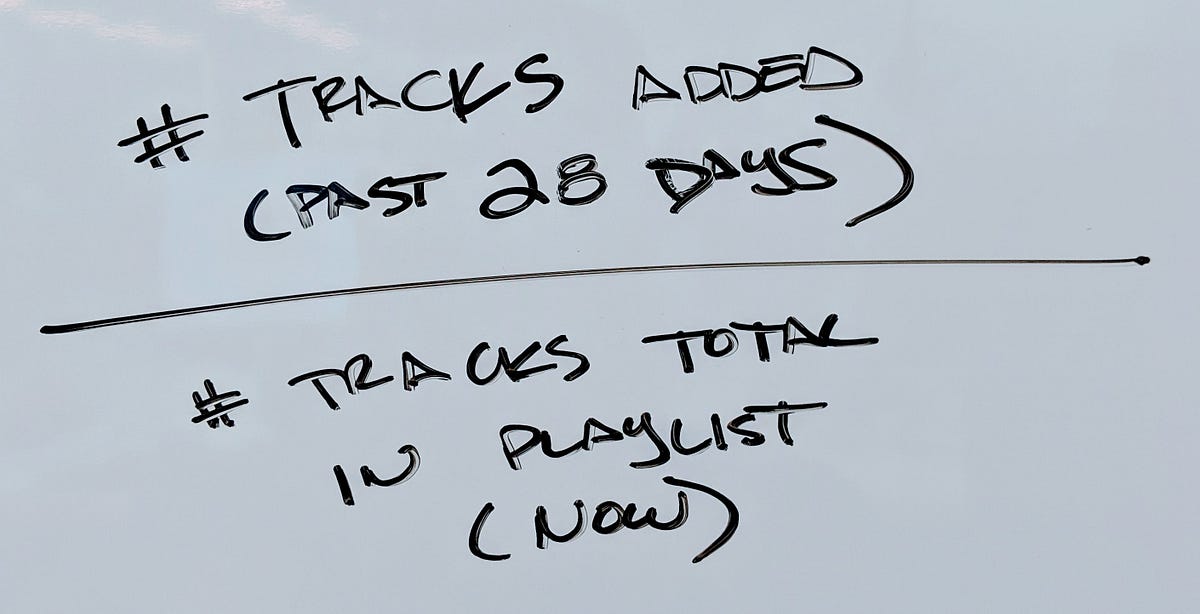
Related but different, a playlist’s “28-day add ratio” characterizes how often a playlist’s curator adds to its playlist. It is a number between 0 and 1, which is simply the number of tracks added to the playlist in the past 28 days divided by the total tracks. So if the add ratio is 1, a playlist has been totally changed within the past month. If it’s 0, then the curator has added nothing (although tracks may have been shuffled or removed).
The idea of this 1–2 punch is for playlist pitching purposes and market knowledge: users can now better understand which playlists cater to certain “track maturity”, and also understand where they have the best placement chances, in terms of a curator’s track refreshing habits.
To better illustrate, let’s take a look at the playlist landscape.
Catalogue Dominates the Playlists Across Platforms
We analyzed the top 1K Spotify playlists by followers, top 1K Deezer playlists by followers, and then 1K Apple Music playlists (note: since followers are not available on this platform, we took 164 playlists we’ve seen displayed on Apple’s “Featured Playlists” section, and then the rest at random).
While this is less than the 1.1M+ playlists Chartmetric tracks across the three major streaming platforms, we believe it’s a fairly representative sample of the population.
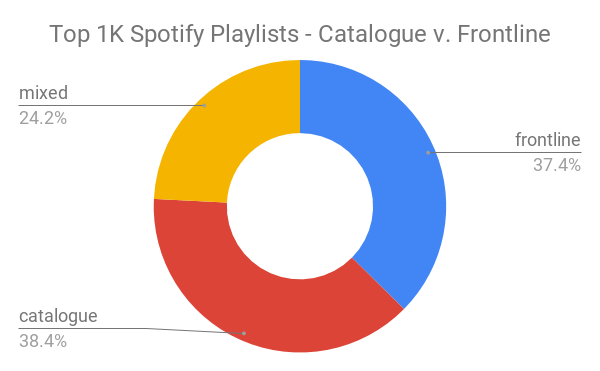
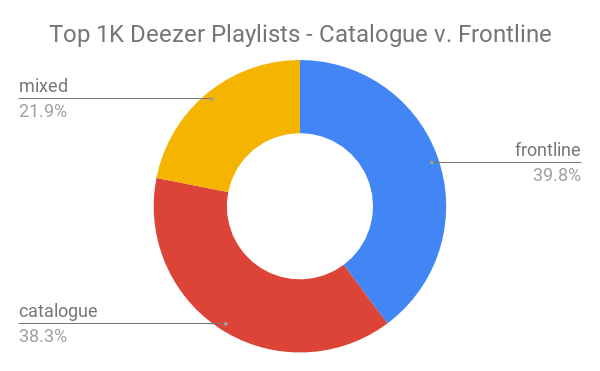
There’s quite an even distribution among our three categories with Stockholm-based Spotify and Paris-based Deezer showing similar preferences. In Spotify’s sample, it slightly favors catalogue playlists at 38%, while Deezer’s sample slightly prefers frontline playlists at 39%.
Such a small difference is negligible, but it is interesting to note Spotify’s distribution isn’t overwhelmingly frontline, as seven out of its top 10 playlists (e.g., Today’s Top Hits, RapCaviar, mint, Viva Latino and Hot Country) all are frontline, and a big reason why they’ve made such an impact on the streaming community. So it’s worth noting that follower, monthly estimated listenercounts or more contextual qualities should be taken into consideration when evaluating each platform’s playlists.
For example, many of Deezer’s most-followed playlists are country-focused (Top Brazil at #5 — 5.1M follows, Top France at #9 — 4.1M follows) and perfect to target certain language demographics, while a few are content-based like the very eccentric Orange Select playlist (#7 with 4.8M follows), currently sporting SoundCloud rapper Juice Wrld right next to Nairobi-born folk-rocker, J.S. Ondara. Such a collection would be ideal for the worldly hipster crowd.
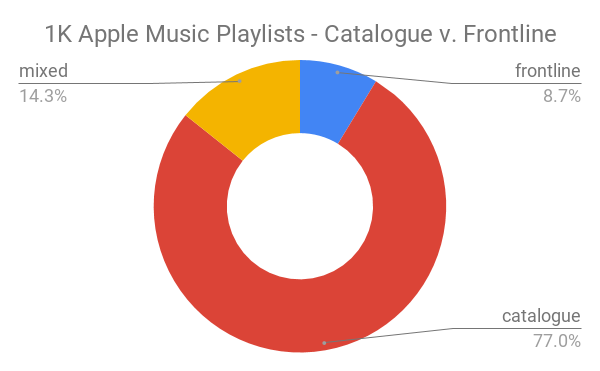
Interestingly, Cupertino-based Apple Music is betting hard into the catalogue space with 77% catalogue playlists, making it a good target platform for labels trying to develop higher revenue streams for its older music. Some of its featured playlists in this category are the context-based Pure Workout/Pure Motivation/Pure Yoga sets, while several single-artist “Essentials” playlists (e.g., Drake Essentials) fill out this category. Only 8% of Apple Music’s playlists in this sample were primarily frontline.
Playlist Track Adding Skews Hot or Cold, Rarely Warm
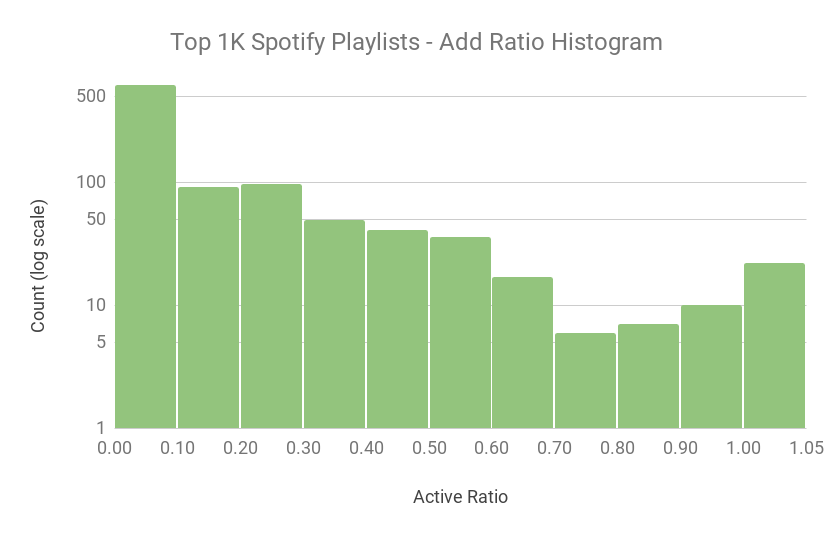
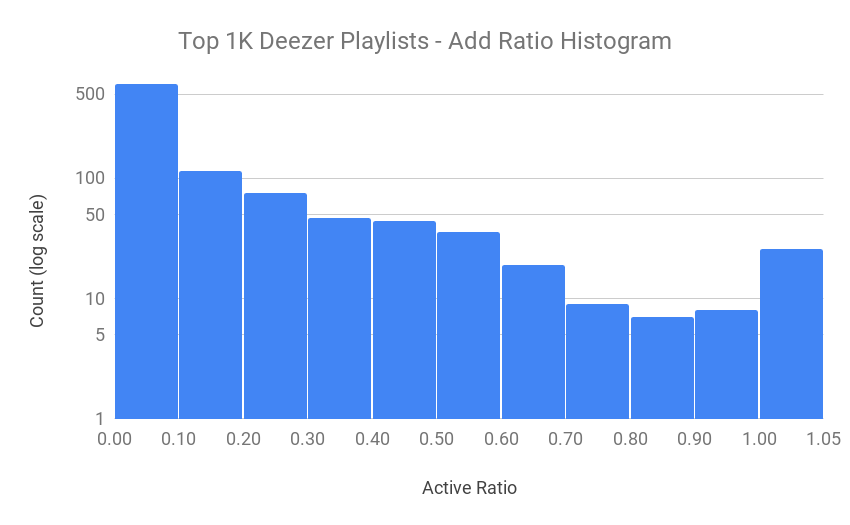
Apple Music, Spotify and Deezer all display similar add ratios, when plotted across a simple histogram. All three heavily lean towards “set it and forget it” curation styles, with 500+ playlists in each sample with static add ratios from 0 to 0.1. This means in the past 28 days, over half of each platform added less than 10% of its tracks to their playlists.
This fact alone should make any artist already placed on a playlist grateful, and a strong reason to direct resources towards a higher ranking on a current playlist, rather than placing on a new one.
Note that these histograms have a log scale y-axis, so extreme counts like this first bin are underplayed visually. Also don’t mind the “1.05” on the x-axis, this just marks a separate bin for perfect 1.0 scores.
All three platforms also show an instant drop to very empty second half of add ratios, from 0.5 up to 0.9, with two platforms showing a spike at the very end from 0.9 to 1.0. Some examples of these actively curated playlists are Apple’s “Today at Apple”, which updates daily the soundtrack played in Apple Stores, and Spotify’s “#ThrowbackThursday”, which is 100% catalogue- firmly showing that just because a playlist is actively curated, doesn’t mean it’s all new releases.
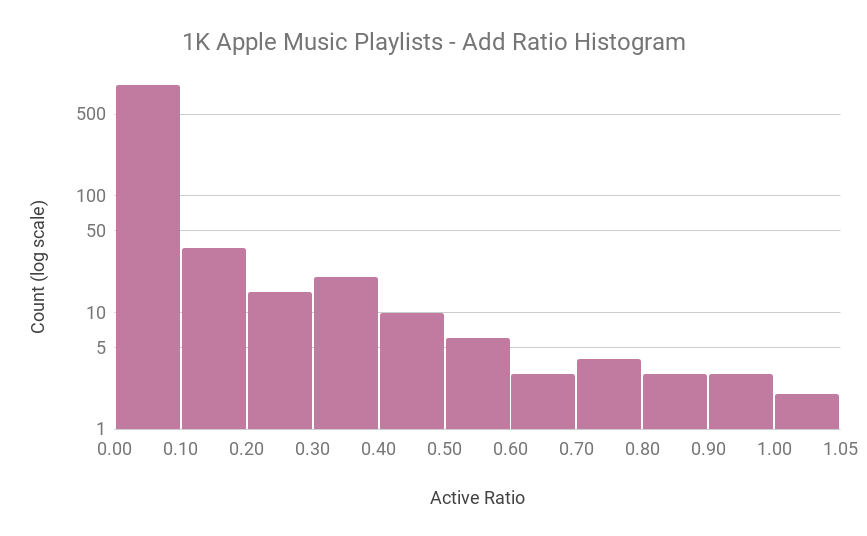
However, Apple Music’s sample had only five playlists with add ratios > 0.9, showing a relative lack of add activity in this region. In the first half of add ratios from 0.1 to 0.5, Deezer (281) and Spotify (279) go neck and neck, while Apple lags far behind at 81. Essentially, Apple’s sample shows it to be the most “set it and forget it” platform, making whatever placements it does make very valuable.
These histograms depict both Spotify and Deezer as more fertile ground for lightly curated playlists, or a “middle class” of curation activity for track adds, if you will, and could signal more fruitful playlist pitching environments.
Frontline + Low Add Ratios = Most Playlists
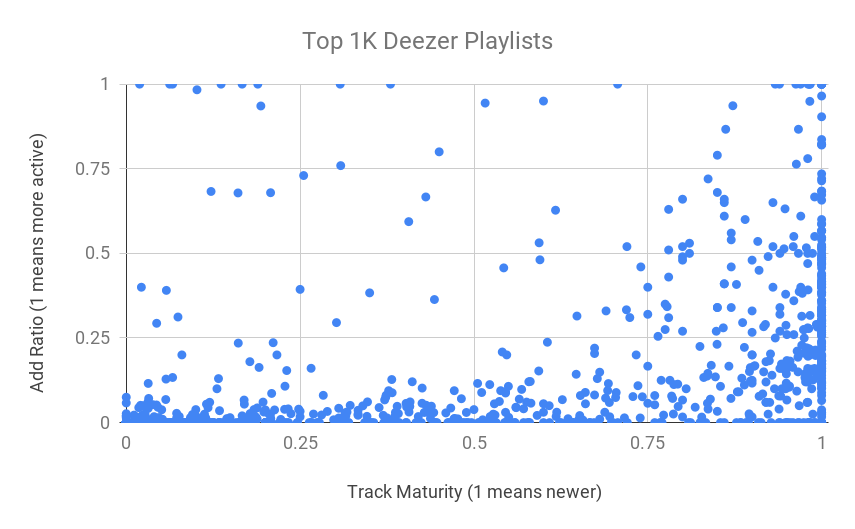
Finally, the following charts are scatter plots, using what we’ll call “Track Maturity”, which is also a 0 to 1 ratio and how we are able to categorize playlists into Catalogue/Mixed/Frontline. We juxtapose Track Maturity to the Add Ratios, looking for how each platform compares with the two new features in Chartmetric.
Essentially, we’re seeing if there’s any interesting grouping between how each platform’s curators relate the “newness” of their tracks with how often they change them.
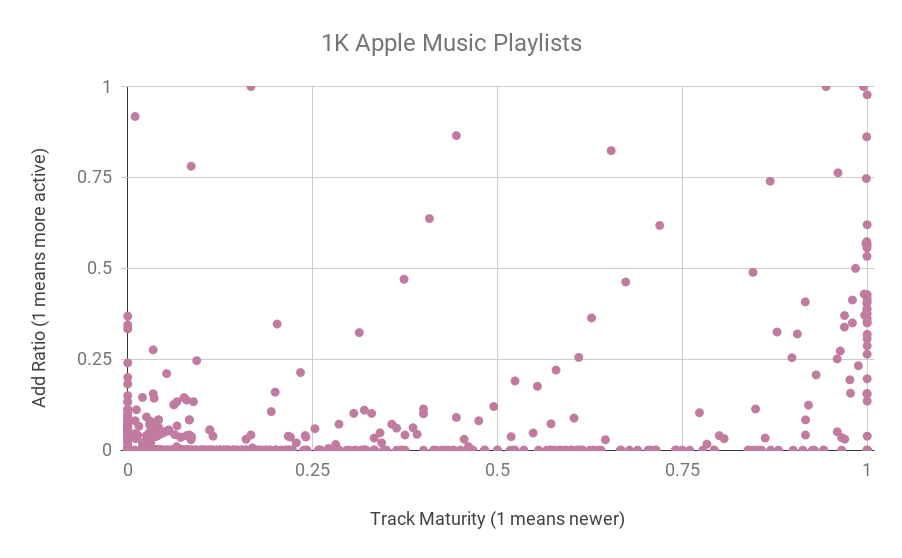
Where all three platforms show common behavior is a heavy embrace of both frontline material (right-most quadrant), as well as a tendency to low add ratios (lower quadrant). There is slight clustering going on in the bottom left quadrant (older track maturity and very inactive track adds), confirming what we’ve already partially seen- that once catalogue playlists get created, they mostly tend to be forgotten (though not all, as pointed out earlier).
Surely, this does not necessarily say anything about how successful a catalogue playlist can be (Spotify’s “Songs to Sing in the Shower” has 3.9M+ follows and an estimated monthly listener count of 845K). But it does suggest that if you are looking to place catalogue tracks, you’re better off searching for the minority of catalogue playlists that have higher add ratios.
As we already observed, Apple Music tends to not update frequently, and so we see a rather empty “middle class” of playlists with medium add ratios. It also features the densest cluster of catalogue/low add activity (lower-left quadrant) of the bunch.
Spotify has a much more equitable distribution of playlist activity, though it seems quite happy with its older-content playlists, as only six of them are Mixed or Catalogue with add ratios over .75. Deezer shows an even more spread-out relationship between track maturity and adding activity, with 39 Mixed or Catalogue playlists with active adds over .25. However, it is easy to see that Spotify or Deezer have no shortage of frontline playlists with lots of track adding happening (though gravitating towards the lower half).
All in all, these scatter plots suggest that Spotify and Deezer lend themselves as more exciting platforms for track placement for all but the most aged records, while frontline unsurprisingly provides most of the “action” among all three when it comes track adds.
Looks like the more things change, the more they stay the same.
Playlist Smarter & In a New Light
“Playlists aren’t just “the new radio” because they have wider reach or influence; they might be the new radio because their format is becoming similarly stale.” — Cherie Hu via Water & Music
As 2018 draws to a close, it’s a foregone truth that playlists are the recorded music industry’s latest norm. Playlist analysis and pitching is a part of our daily operations, while New Music Friday has become central to our work weeks and a bright spot for fans turning up for the weekend.
It’s even stretching the traditional notions of “frontline” and “catalogue”: if a Bruce Springsteen or Rolling Stones put out a new album, some temporarily consider their entire discography “frontline” due to their refreshed release status. Or if a formerly promising emerging artist falls out of favor publicly for too long, some would consider their body of work “catalogue”.
But despite playlisting’s capacity for sea change, this “new radio” will sooner or later be replaced with a newer way for artists to connect with their fans. It surely happened to mp3s, CDs, cassettes, vinyl, radio and the early phonograph.
Whether that be a friendly voice named “Alexa” or a legion of live-streaming musicians spending hours with their fans on a daily basis, music has always been the bloodied sibling running through the glass door of technology first, for the rest of the entertainment industry to learn from.
But until that day comes, Chartmetric is standing watch with our two newest playlist features. We hope it helps get your music to your fans faster and more efficiently.
Happy holidays and here’s to a great 2018!
Enjoyed the read? Smash that clap button, share with colleagues.
Questions about these features? Want to chat with us? Send us a hello at hi (at) chartmetric (dot) io, or feel free to ask a question in our chat in the lower right-hand corner here!
