
It may be difficult to believe, but musicians will return to the stage. With live music on pause, now is a good time to learn how to tour better and smarter than ever before.
There is a host of geo-specific streaming data available. Here is how to use.
Part 1
By Rutger Ansley Rosenborg from Chartmetric
Let’s say you’re working with an artist who’s just about to release new music. Following the typical release cycle, the next step would be to plan out a tour to promote their new music (these days, music is really the marketing driver for revenue-generating tours and not the other way around, but that just makes tour optimization all the more important). Where do you start?
When it comes to booking tours, there are so many variables to contend with, from venues having shows already booked on the dates you want, to an outrageous distance between cities in a country as vast as the US, to mechanical failures, flight delays, theft, and so much more. That’s why the most important thing to remember is that streaming and social data will only help you better optimize your tour routing; nothing beats real-world experience when it comes to the live space.
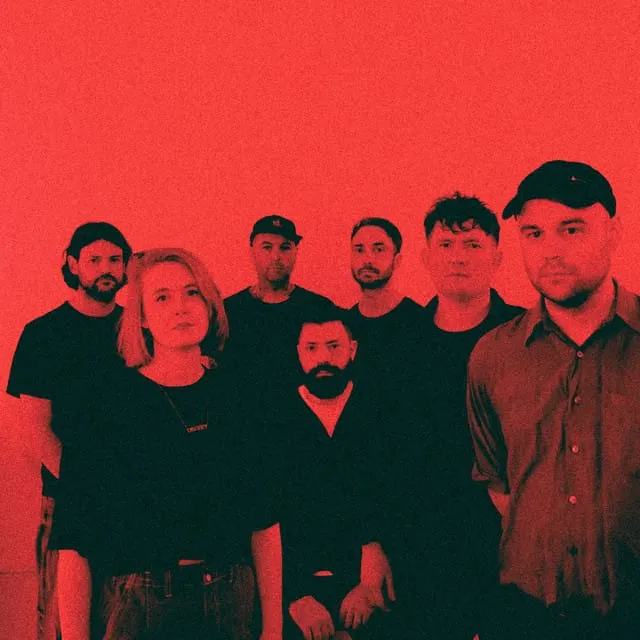
So, let’s pretend you’re Spanish Garage Rock four-piece Hinds, who we know are releasing a new album in April. If you’re looking to tour the US, what’s your most comprehensive data source, geographically speaking? Clicking on the Audience tab on your Chartmetric profile, it looks like Spotify is, so that’s a pretty good place to start.

Listeners in New York City appear to account for around 8 percent of your total Spotify MLs, a percentage that’s only beat by your hometown of Madrid, so that should indicate the importance of the Big Apple for your American audience base. Using NYC as an anchor point, let’s fan out from there.
Philadelphia (1.3 percent), Cleveland (1 percent), and Chicago (4.1 percent) are all clustered in the Northeast, so those could be good cities to hone in on. Toronto (1.6 percent) is in Canada, but it’s close enough to NYC to make happen as well.
The next grouping of cities is in the South: Dallas (2.1 percent), Houston (1.9 percent), Austin (1.4 percent), and Atlanta (1.7 percent). And looking West, Los Angeles (4.6 percent), the San Francisco Bay Area (2.4 percent), Portland (1.3 percent), and Seattle (2.4 percent) are the next MLs hot spots.
US cities with significant Spotify Monthly Listeners percentages for Hinds.
Now, streaming and social data don’t necessarily correlate with people coming out to your shows, so you’ll want to cross reference as many different sources as you can to maximize the probability that the physical demand will actually be there.
The locations of your YouTube Viewers and Instagram Followers are looking pretty in line with Spotify MLs for NYC and LA, so whatever route you choose should probably be based around those industry epicenters. There’s some indication that Chicago, the SF Bay Area, Seattle, and Toronto also check out across the board, so mark those as the next dots to connect, splitting up the journey into a Northeastern leg and a Western leg and adding a Southern leg if you have the budget.
US cities with significant YouTube View and Instagram Follower percentages for Hinds.
Fortunately, we already have Hinds’ Spring tour schedule with which to cross-reference our approach. Philadelphia, Toronto, the SF Bay Area, LA, Austin, Dallas, Houston, Atlanta, Portland, and NYC are all there. That’s 10 out of 13 — not bad. Maybe Cleveland, Chicago, and Seattle are worth taking a second look at?
While there’s never really any exact science in the music industry, optimizing your route is usually one of the first steps in making a tour work for your music and vice versa. Fortunately, today’s streaming economy has opened up a world of geo-specific consumer data for all to see.