

Spotify has risen to become one of the top players in the music industry, and an artist’s success on the platform has a huge impact on their overall career trajectory. Here, Chartmetric helps artists to understand and synthesize the data provided to them through Spotify Analytics for Artists, and how they can use it to leverage their performance on the platform.
Guest post from Chartmetric
Decision-making in the music industry is increasingly about innovative insights and being the first to discover new trends, artists, and opportunities to engage audiences.
In today’s streaming economy, artist success on Spotify is one of the leading indicators of artist success across streaming and social platforms and music industry verticals, which is what makes understanding your artist Spotify data so important.
Brief History of Spotify
While Spotify officially formed in 2006, Daniel Ek originally developed his idea for a service that was “better than piracy but at the same time compensates the music industry” in the wake of Napster’s fall in 2002.
At the time of Spotify’s founding, Ek was CEO of uTorrent, a digital piracy and peer-to-peer sharing platform. Following uTorrent’s acquisition by BitTorrent in late 2006, Ek doubled down on his vision for digital and economic innovation in the music industry … and the seeds of the streaming revolution were sown.
In 2008, the Spotify application launched in Sweden, with founders Ek and Martin Lorentzon announcing licensing — and ownership — deals with the major labels (Sony Music Entertainment, Universal Music Group, and Warner Music Group). A year later, the company had expanded to the United Kingdom, and two years after that, in 2011, the United States.
By that time, Spotify had a paid subscriber base of about 1 million in Europe, and in 2012, that number had ballooned to 4 million worldwide. Four years later, Spotify announced 40 million paid subscribers and 100 million total users, cementing streaming as the new mode of global music consumption in the music industry.
Just before that milestone, Fan Insights made its way into the platform’s back-end, allowing some artists and their teams to see a limited amount of information about their streaming data, from demographics to geography. In 2017, Fan Insights became Spotify for Artists, giving all artists and their teams a window into their stream, listener, demographic, and geographic trends on the platform.
In 2018, Spotify made their Initial Public Offering with a market capitalization of almost $30 billion, and with more and more global markets continuing to come online, Spotify analytics for artists and their teams are only increasing in importance.
Leveraging Your Spotify Analytics
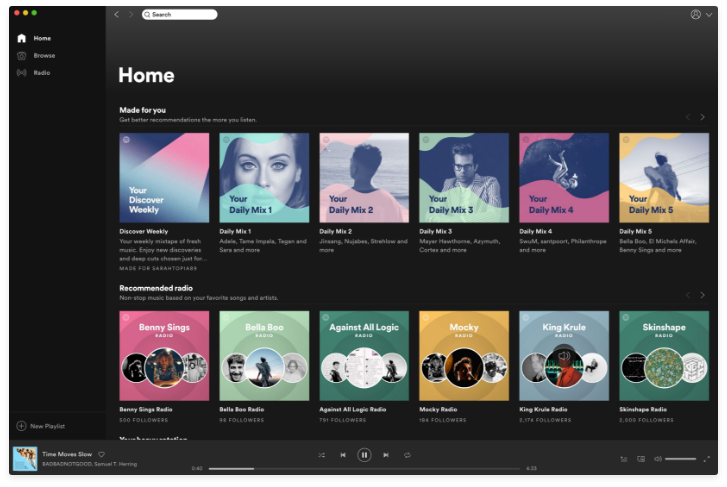
For both tracks and albums, what makes Spotify for Artists so valuable for an artist and their team is an absolute count of an artist’s streams, listeners, and saves. That’s something you can’t really get anywhere else. The analytics platform also provides an easy-to-understand breakdown of playlist categories (algorithmic, editorial, and listener generated) and absolute counts for listeners and streams of an artist’s tracks on those playlists.
Not only can you track an artist’s all-time listener, stream, and follower growth, but you can also compare that artist’s stats with up to two other artists over the last seven days, the last 28 days, and since 2015.
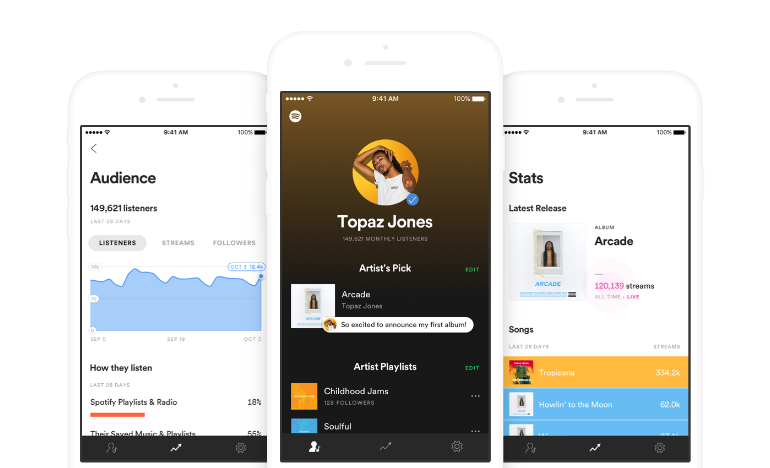
As far as listener metrics go, you can see a breakdown of your stream sources, from your own profile and catalog to listeners’ own playlists and libraries to other listeners’ playlists to algorithmic vs. editorial playlists. Drawing from this data, Spotify for Artists generates a “Listeners also like” section, which includes 10 or so similarly listened to artists — another great way to see how you stack up against a similar grouping of artists.
If you’re looking for a gender and age breakdown of your listeners, along with absolute counts for country- and city-specific listeners around the world, Spotify for Artists has that, too — plus, you can edit your Spotify artist profile, make artist playlists, promote your concerts, and feature your newest track.
For artists and their teams, having these detailed insights into streaming metrics makes Spotify for Artists an absolutely essential tool in today’s increasingly data-driven industry.
How Chartmetric can help

Once you’ve mastered Spotify’s analytics tool, with the power of data science, our tools can take your streaming analytics game to the next level by expanding your scope to include market-level data.
Putting Your Track and Playlist Data First
Because tracks rule the day on streaming platforms, that’s what we try to bring to the fore, letting you filter not just your artist’s — but any artist’s — tracks across a number of dimensions. You’ll also be able to see instantly how many Spotify playlists each track has landed.
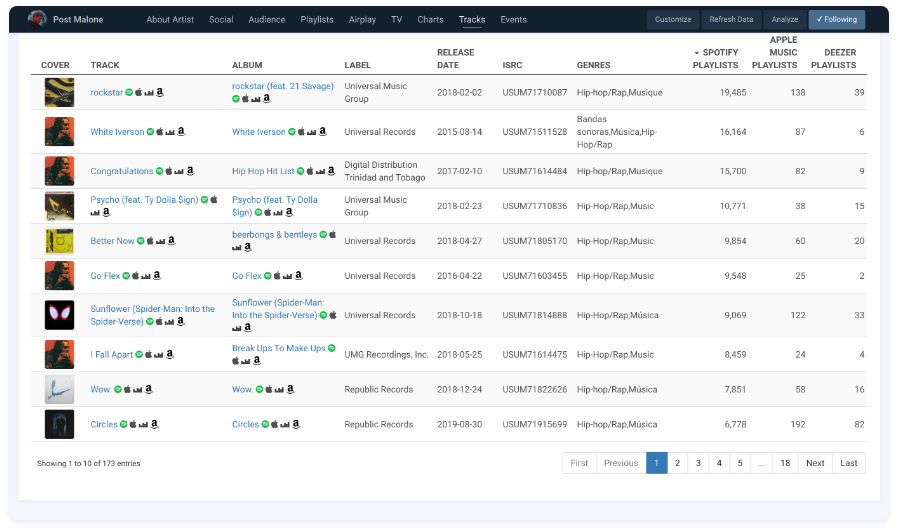
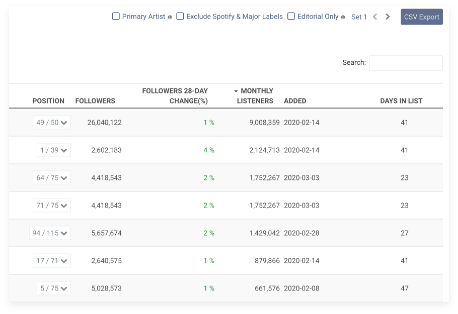
Speaking of playlists, you can use Chartmetric to break down all of the Spotify playlists an artist has ever been added to, sorting by playlist Follower count, Monthly Listeners, and more, and filtering by editorial or non-editorial playlists. Then, you can follow the growth of an artist’s Playlist Count and Playlist Reach over time.
Engaging With Your Global Audience Data
Our audience analytics allow you to track artists’ Spotify trajectories throughout their careers, keying in on important releases and events and monitoring daily changes in Followers and Monthly Listeners — not to mention Spotify’s own Popularity Index and platform rank.
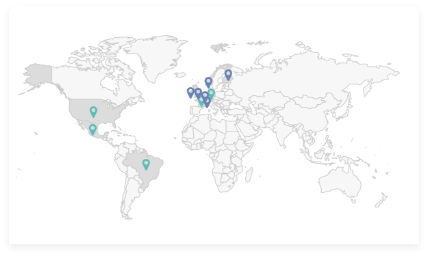
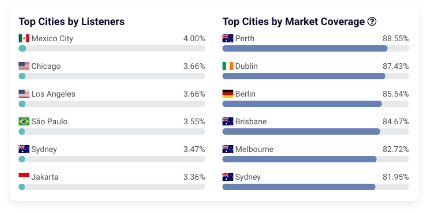
Our geographic data provides a city-specific breakdown of an artist’s listener base worldwide, both in terms of listener count but also in terms of the percentage of an artist’s total listeners and how the geographic distribution of their audience has changed over time.
Comparing Millions of Artists at the Market Level
With Artist Pages for the 2M+ artists in our database, you can quickly compare Spotify metrics like Spotify Fan Conversion Ratio, Spotify Popularity, Spotify Rank, Playlist Reach, and Playlist Reach to Followers Ratio. And if you’re looking to turn those comparisons into relationships — collaboration, touring, or otherwise — group similar artists by genre and key Spotify metrics like Popularity, Followers, Monthly Listeners, and Monthly Listeners to Followers Ratio.
Powering Your Streaming Data With Data Science
On top of our Spotify analytics, we also have a growing list of metrics and original insights powered by data science, which are key to artist success on Spotify and in a digital music economy.

Who is Chartmetric?
We are a small, highly skilled team with members from diverse backgrounds, and that diversity is celebrated just as much as our work is. We’re talented solo artists, but we’re a much better band. We are as much music data rockstars as we are music superfans, and we thrive as a bridge between music and technology, data and creativity.
Sign up for a free account at chartmetric.com, dive deeper into our features at blog.chartmetric.com, and check them out for yourself. We can’t wait to see what you create.