Here, we follow the money and dig into the history of how inflation has historically impacted artist royalties, and why they should be concerned about inflation protection for mechanical licenses now.
By Chris Castle from Music Tech Solutions
In a word: Stagflation. Maybe. In more words, classic stagflation occurs when supply side shocks lead to the costs of goods increasing while the real economy declines. We certainly have had and continue to have supply side shocks and it’s hard to tell what the real economy is doing because of distortion. Due to the COVID pandemic, the global economy has been hit with a cascading series of supply side shocks. For example, one shock is due to supply chain disruptions which look something like this:

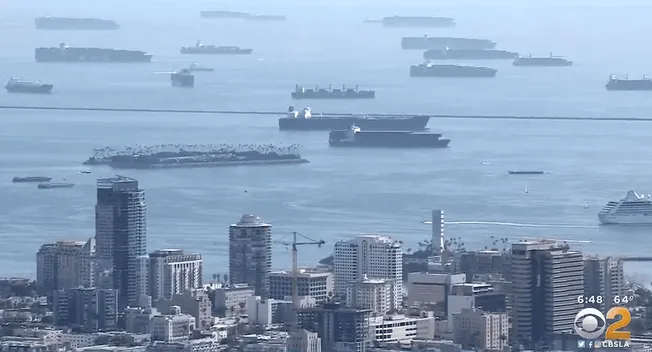
If you’ve ever been on one of the very large cargo ships, you will know that is a big mofo. (When a sailor looks at all those elephants churning up the water, you can’t rule out a collision which could have really big problems depending on where and how bad that collision is.)
There currently are something like 500,000 shipping containers sitting on ships off of the Port of Los Angeles that can’t unload. That means someone has ordered the goods in the containers, perhaps paid in advance all or part of the cost of those good, but can’t get the goods to sell. And that’s just Los Angeles. That’s also called a supply side shock.
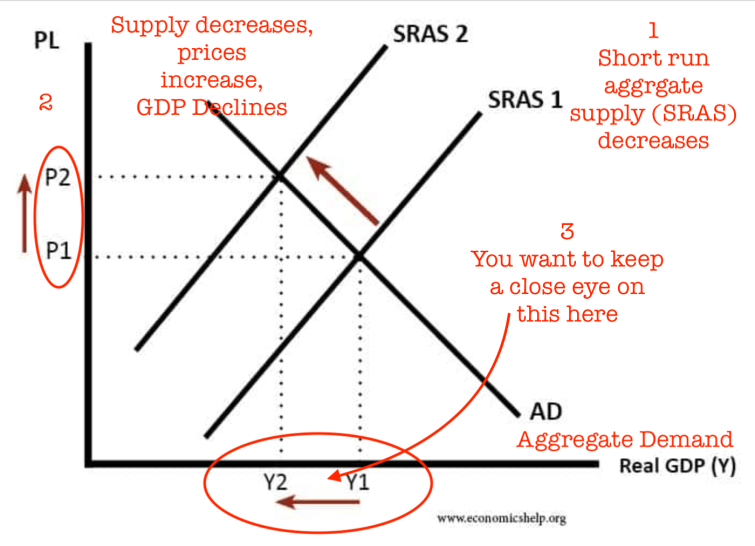
A supply side shock may cause an increase in the prices of the goods that are available to sell which causes a shift in the aggregate prices in the economy as a whole.
Another supply side shock may occur when inflation causes the price of goods to increase over the level that a firm can eat to avoid passing on the cost to their customers. This causes earnings to decline and eventually share prices to decline. If the market does not re-establish equilibrium fairly quickly, right after earnings decline, the price may get passed on to the consumer which may cause demand to drop which will ultimately cause earnings to decline. This is cost-push inflation which is a bit different from what you normally hear about too many dollars chasing too few goods or demand-pull inflation.
So to recap: cost-push inflation is a decrease in the aggregate supply of goods and services caused by an increase in the cost of production, and demand-pull inflation is an increase in aggregate demand from one or more or all of households, business, governments, and foreign customers.
Inflationary pressure is compounded by an increase in the money supply, especially a sharp increase in the money supply.
All this should be sounding familiar if you follow the news.
Historical examples of stagflation events in the US are particularly related to energy cost shocks and OPEC’s use of oil embargos to influence US foreign policy and support for Israel. We’ll come back to this, but remember that the crippling stagflation of the 1970s was largely due to one input–energy. The gas lines of the 1970s and heating oil price increases were particularly profound and the resulting stagflation influenced the increase in interest rates to a prime rate of 21.5% in December of 1980 after President Jimmy Carter lost reelection. It may be hard to comprehend a prime rate of 21.5% in this low interest rate environment, but don’t feel bad–it wasn’t so easy to understand then, either. The shys were jealous.
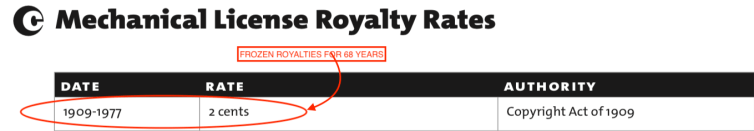
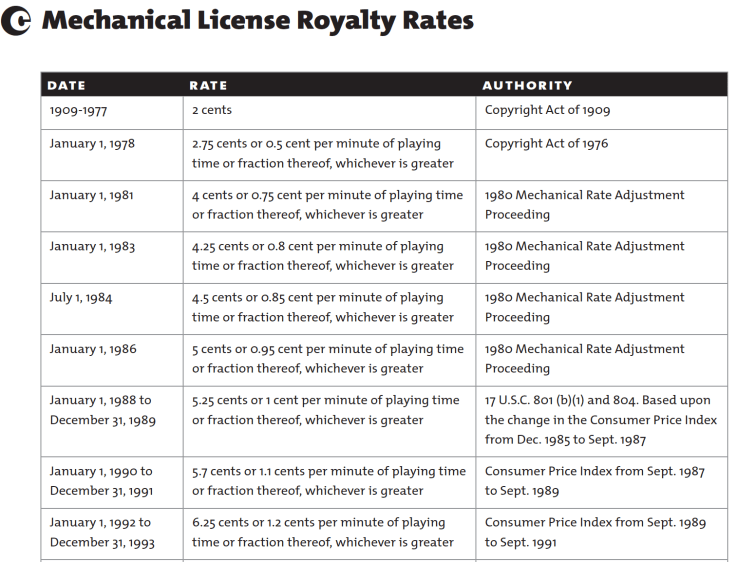
Could it happen again? At this point, I think it’s hard for anyone to rule it out entirely, so the probability is a positive integer. What did songwriters do during the stagflation era of the 1970s? Unlike most of the rest of the peacetime economy, songwriters had mechanical royalties set by the government at a fixed price. Starting in 1909, the federal government set songwriter royalties at 2¢ per unit and never changed the price until 1978. Needless to say, the stagflation of the 1970s destroyed the government’s fixed songwriter royalties. By 1978 it’s not an overstatement to say that songwriters earned a negative royalty rate if you adjusted for inflation. This was all due to the government’s wage controls on songwriters. (You can argue that this is the primary reason songwriters get paid so little today.)
Why did this happen? Government mandated wage and price controls were common in wartime–during World War II, military expenditures exceeded 40% of gross domestic product (GDP) so the government had an interest in controlling labor and materials costs. They accomplished this through the War Labor Board and the Office of Price Administration. If that sounds positively Soviet, it was. Unlike songwriter royalties, the government mandate was temporary.
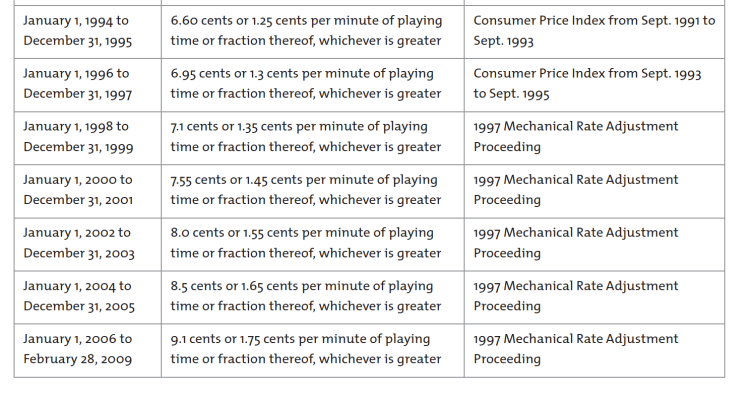
By the time the 1976 revision to the Copyright Act rolled around, songwriters lobbied effectively for their statutory mechanical rate to be increased. However, given the rampant inflation of the time, they needed protection because even with prices reset after five year periods, inflation could easily eat away any gains. That’s one reason why after the 1976 revision, mechanical rates gradually increased and eventually were increased based on the Consumer Price Index (called “indexing”) for many years.
If you followed the recent commentary opposing an extended freeze of the mechanical royalty rate for physical and downloads, the inflation issue is front and center once again. And if you observe the current state of the economy and the likely future, you’ll understand why indexing may be crucial to preserving the value of whatever mechanical royalty is set by the Copyright Royalty Board, the songwriter’s version of the WWII era Office of Price Administration. And who would bet against inflation?
Of course, the CRB heard absolutely no evidence on the inflation issue from the NMPA, NSAI and the major labels that essentially put their finger in the air and decided to freeze rates. That’s not the end of the story, though. The relevant information on inflation is readily available in the public domain and the CRB can take notice of it if they want.
Remember, the 1970s stagflation was a highly unusual economic condition caused by a supply side shock of one input–energy. Here’s a few examples of current supply side shocks from multiple inputs. I think it should give everyone pause before they rule out a need to index the statutory rates for songwriters.
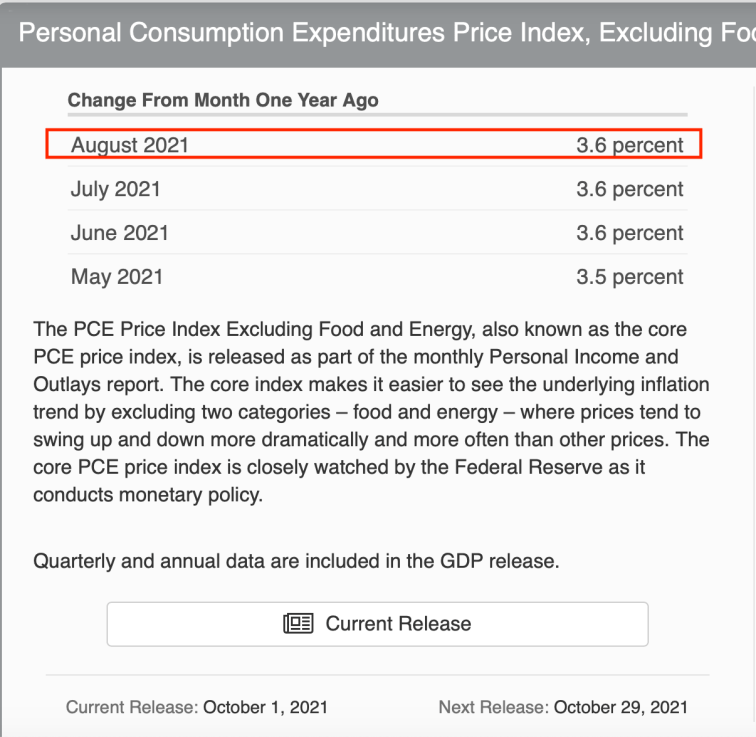
Personal Consumption Expenditure Index (US Govt. Bureau of Economic Analysis)
The “PCE” and “Core PCE” are indexes that economists monitor (such as the economists at the Federal Reserve) to track inflation trends. So let’s see what these metrics tell us about the inflationary trends that would be an argument to support indexing mechanical royalties.
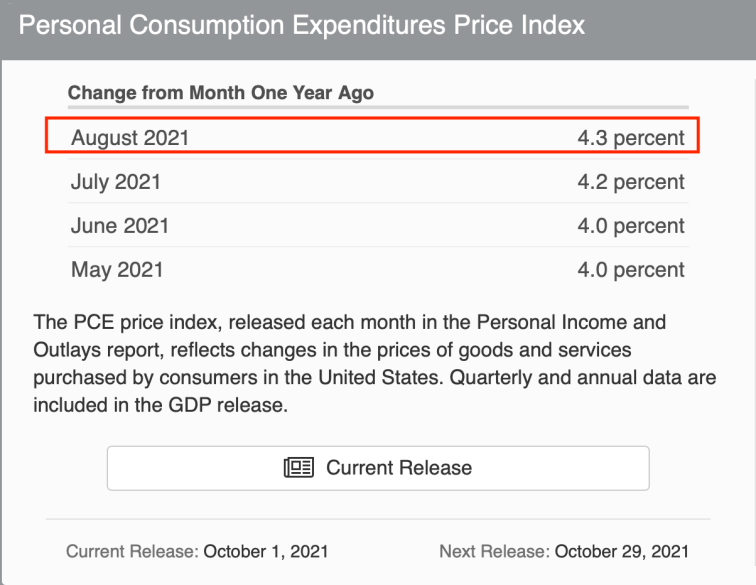
“Core PCE” is another look at consumer prices that excludes the cost of food and energy which doesn’t make much sense to you and me, but is another way to look at underlying inflation trends for economists. This is important because it can influence decisions about interest rates at the Federal Reserve.
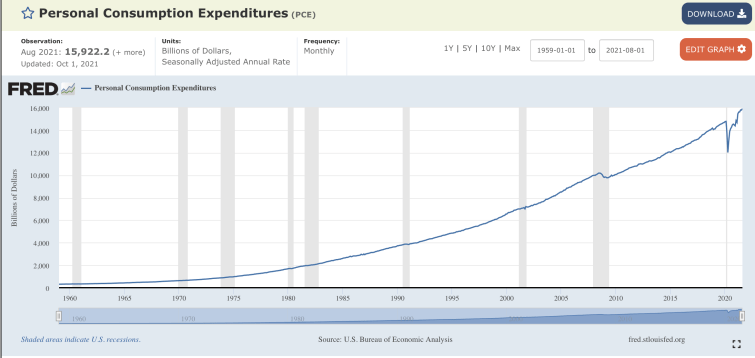
For perspective, here’s a five-year look at PCE and at PCE excluding food and energy:
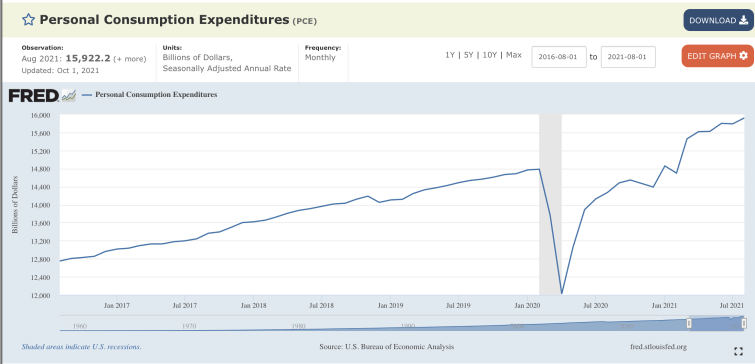
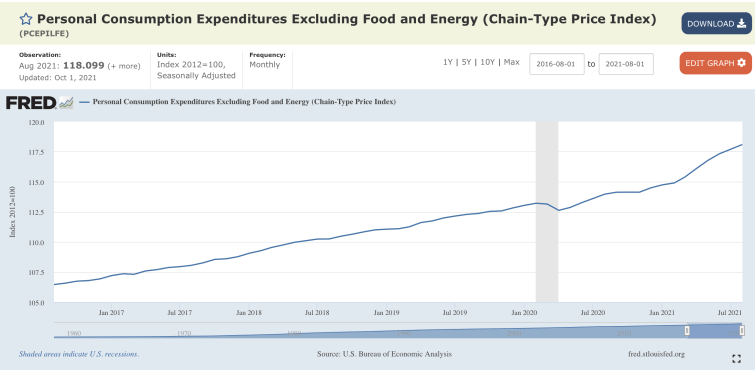
The data tell us that the five year inflationary trend is up and to the right with an increasing slope. It is the sharpness of that increasing slope that gives pause–the inflationary trend has been up since 1959 per the following chart, but the steepness over the last 12 months is unusual.
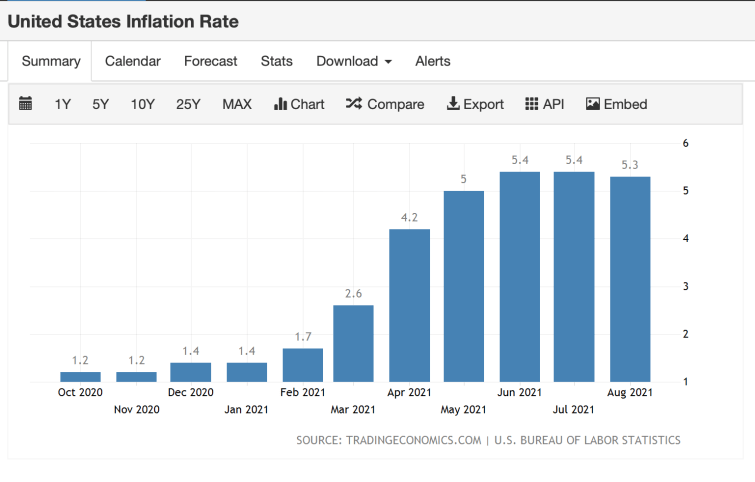
Overall US Inflation Rate
The PCE and Core PCE is confirmed by the overall U.S. inflation rate as measured by the U.S. Bureau of Labor Statistics:
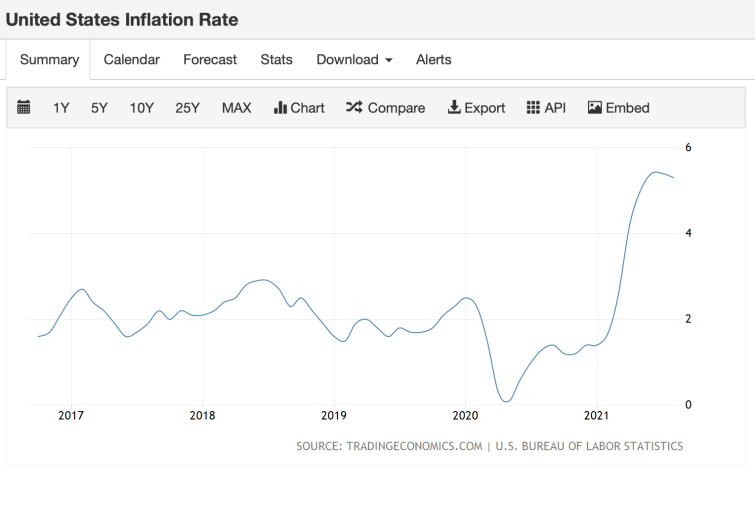
You see the trend here. Inflation has sharply increased. Consider the last twelve months–inflation has more than quadrupled.
Do we think it will continue to increase or will it decline? Let’s consider the inputs that can cause that supply side shock we talked about above.
Residential Rent Prices
According to Zillow, “[t]ypical U.S. rents grew 9.2% year-over-year in July, according to the Zillow Observed Rent Index (ZORI) — the fastest recorded by Zillow records in data that reaches back through 2015 — to $1,843/month. Projecting forward historical ZORI values from February 2020 — the last full month before the COVID-19 pandemic hit the U.S. in earnest — we estimate that the U.S. ZORI in July was 2.9% ($52) higher than where it would have been if the last roughly 18 months had been more ‘normal.’ “
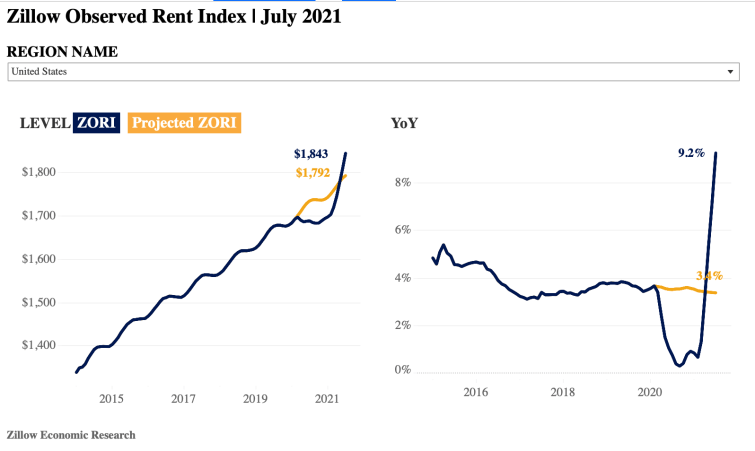
After dipping last spring, rents around the U.S. have not only recovered but are now blasting past their pre-pandemic levels. In 44 of the nation’s 50 largest metro areas, rents have surpassed where they were before the health crisis, according to data from Realtor.com. Nationwide, the median rent reached a record high of $1,575 in June, an increase of 8% from a year ago.
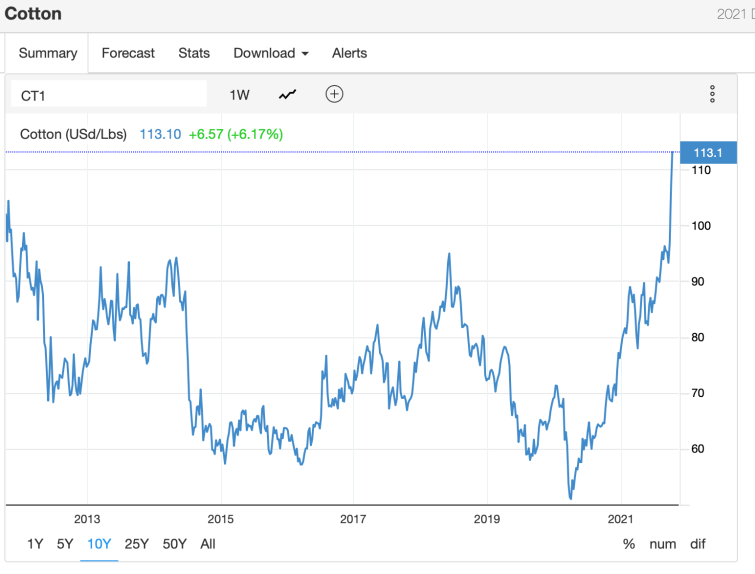
Cotton
Cotton is a commodity that finds its way into many goods. The Wall Street Journal reports that cotton prices have surged to their highest level in a decade, but that Levis won’t be passing on the cost increase to consumers–yet. Remember cost-push inflation?
Levi’s commentary on the cotton-pricing issue should soften some of those fears—at least in the near term. On its earnings call Wednesday evening, the apparel company said that much of its own cotton prices have already been negotiated for the first half of 2022 and that it expects its cost of goods sold to increase 1% in the first half of 2022 compared with 2021 levels. For the second half of 2022, the company said it might be able to negotiate prices that will lead to a mid-single-digit percentage increase in costs compared with 2021 levels. Cotton accounts for about a fifth of the cost of producing Levi’s jeans.
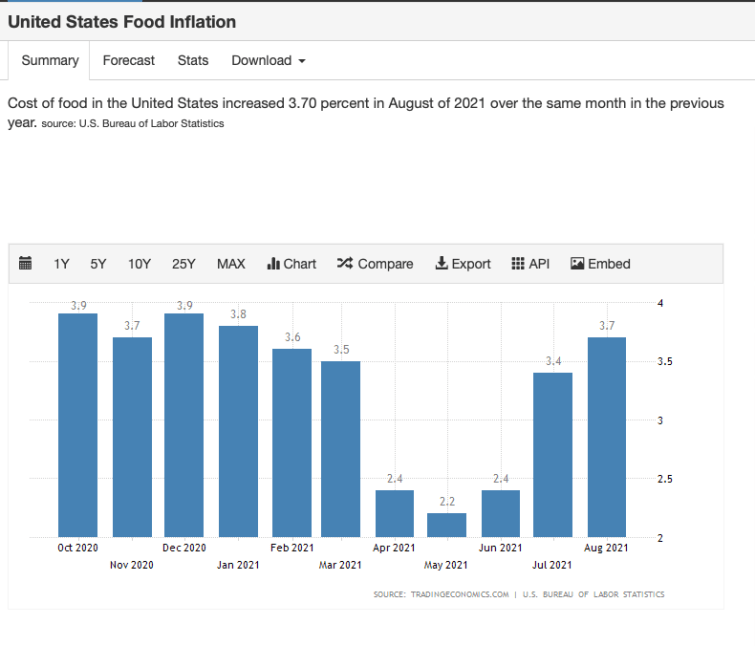
Food Inflation
If you’re going to just look at the core PCE without food and energy, you can’t just ignore those two key inputs if you want to know what is going on at the micro level. We’ll look at both food inflation as well as inflationary effects on a few key energy components, especially for touring bands. Consider this chart of food inflation in the US over the last twelve months which itself is slightly higher than the core PCE.
Propane
Propane–also known as heat–is a lot more relevant to consumers particularly as we head into winter. Propane generators are of particular interest to anyone who suffered a power outage during a polar vortex–ahem–and as you can see, propane prices are already through the roof.
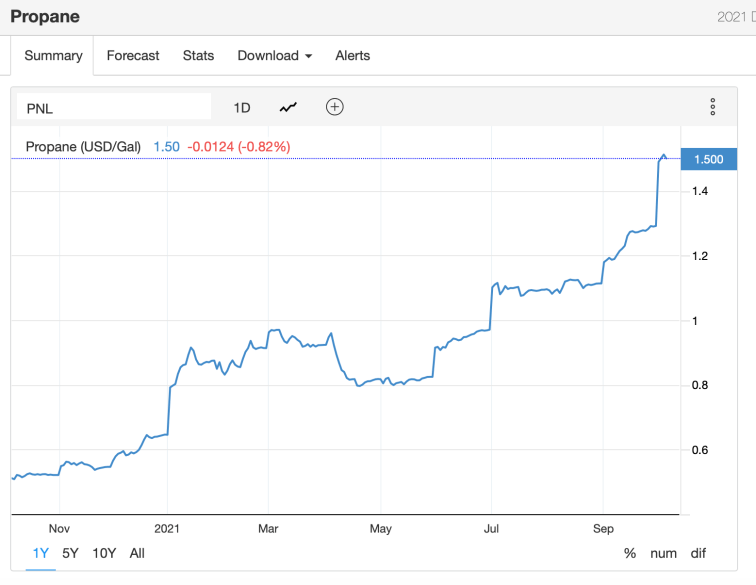
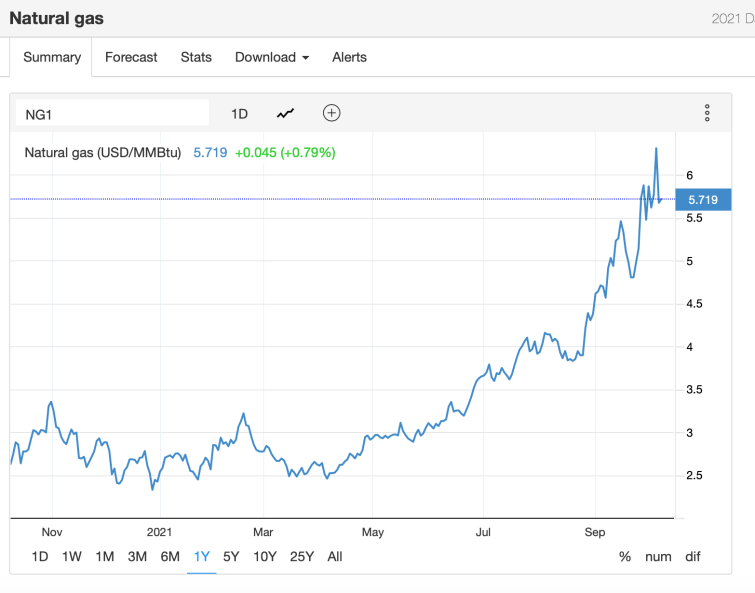
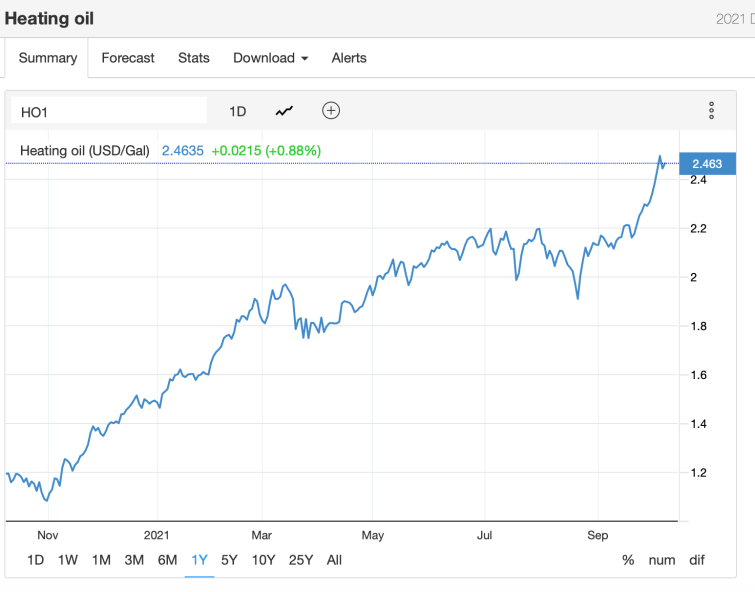
Same story for natural gas and heating oil.
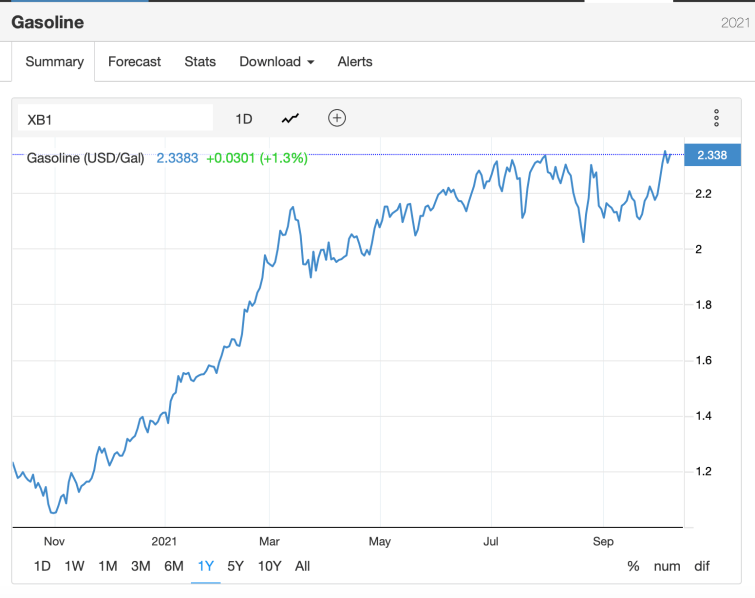
Gasoline
If you’re planning a ground tour, keep an eye on the price of gasoline, also up and to the right.
10 Year US Treasury Bonds
You may not be aware of it, but practically everything in your financial life is affected by the 10 Year US Treasury bond. The “10 Year” is used as a reference point for a multitude of financial instruments and interest rates around the world. This includes mortgage rates and credit card rates. As you can see, over the past 12 months, the yield on the 10 Year treasury note has increased or nearly doubled. And remember that the bond market is orders of magnitude larger than the stock market. The bond market is also run by sophisticated traders–I’ve never heard of day traders in the bond market.
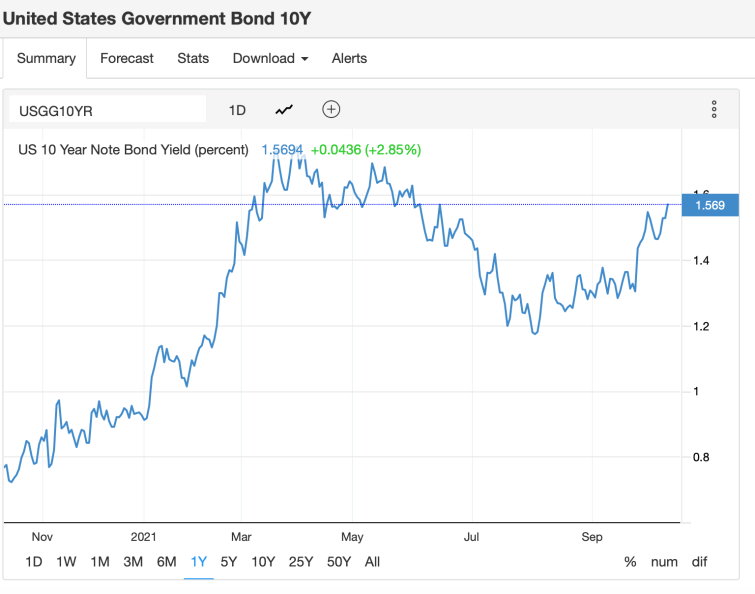
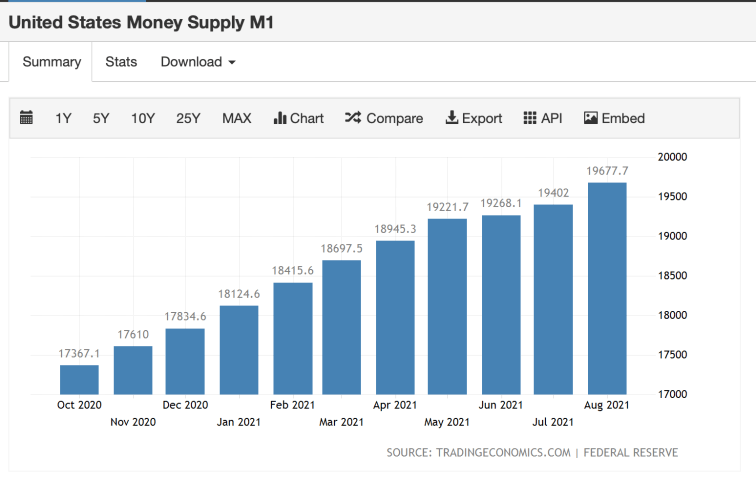
You want to keep a good eye on the 10 year because the Federal Reserve plans to “taper” which is one of those fancy names like “quantitative easing” that sounds like a caramel macchiato but is actually not. What that means in a nutshell is that the Federal Reserve plans on buying fewer treasury bonds than they have done–sopping up however much debt that Congress wants to take on. (Some people say this is a lot like printing money–remember that increasing the money supply is one of the causes of inflation, particularly sharp increases in the money supply.)
A cynic–certainly not me–might say that the Federal Reserve keeps the interest rates low because if the U.S. government ever had to pay anything like a market interest rate, the country would go under. But this cannot go on forever, hence “tapering”.
People may disagree with this “printing money” analogy, but the money supply has substantially increased in the last 12 months and it came from somewhere.
Conclusion
If you stayed with me this far, thank you. I hope I’ve persuaded you that it in the current environment it is highly dubious that songwriters should ever agree to a fixed mechanical rate for any configuration that is not indexed to inflation. Even if you don’t think that stagflation is around the corner, we are certainly seeing considerable inflation in a number of inputs–the supply side shock that is the hallmark of a period of stagflation may not come solely from energy this time. Just because energy was the culprit before doesn’t mean that the economy will not succumb to stagflation by a thousand cuts in the future.