

The Recording Industry Association of America has been collecting U.S. recorded music sales data for 50 years. Many important stories are contained in that much data, and RIAA SVP of Research & Economics Joshua P. Friedlander is the best person to uncover them.

by Joshua P. Friedlander, SVP Research & Economics, RIAA
Accurate and transparent data can be a tremendously valuable resource – for journalists and historians and music fans and investors and employees and so many more who care about music. That’s why, for decades now, the RIAA has published U.S. recorded music revenue numbers. These reports have become a standard by which the industry is measured.
As the world of music grew more complex, so too did the data. Artists and label teams dug into the massive amounts of new information that became available, from sales reports to stream counts. They found new ways to collect and share data with artists – building portals and dashboards so artists could watch their work take off in real time. Artists and their teams pioneered new partnerships to reach fans through ever-broadening arrays of options, from old school fan clubs to cutting edge social networks. And our entire industry found new ways of learning from and building on the rich new information that had become available. All this has given artists more tools than ever to find an audience and bring their music to them.
Interest in all this data and what was happening increased as well. That’s why in 2009 the RIAA launched the online shipments database. At one stop, anyone interested could find all the data they needed back to 1973 on sales volumes and revenue totals for physical and digital formats of music in the United States.
It looked something like this:
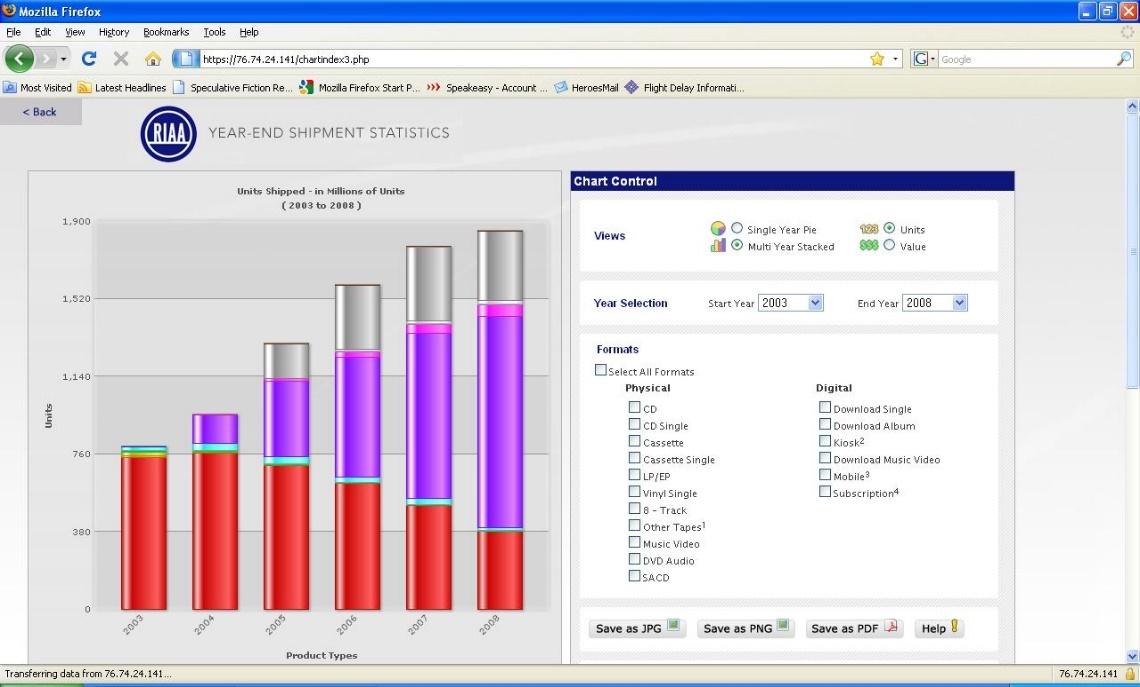
More than a decade (and a design makeover or two) later, the revenue database is still going strong. The most recent addition of 2022 annual data makes a total of 50 years of information now accessible on the site. With all the data in one place, so many stories can be told.
[Full RIAA US Sales Database: https://www.riaa.com/u-s-sales-database/]
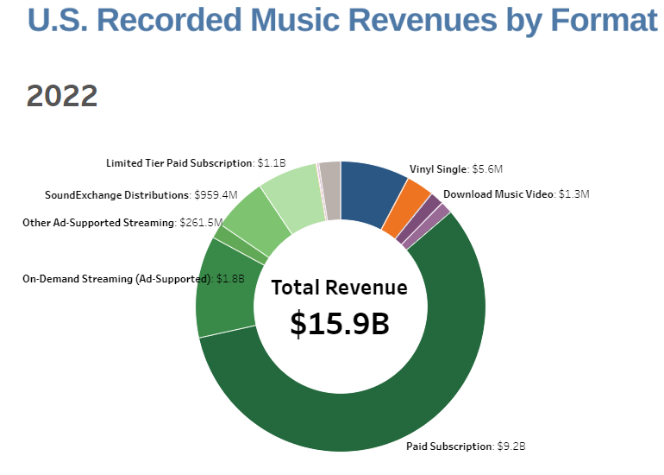
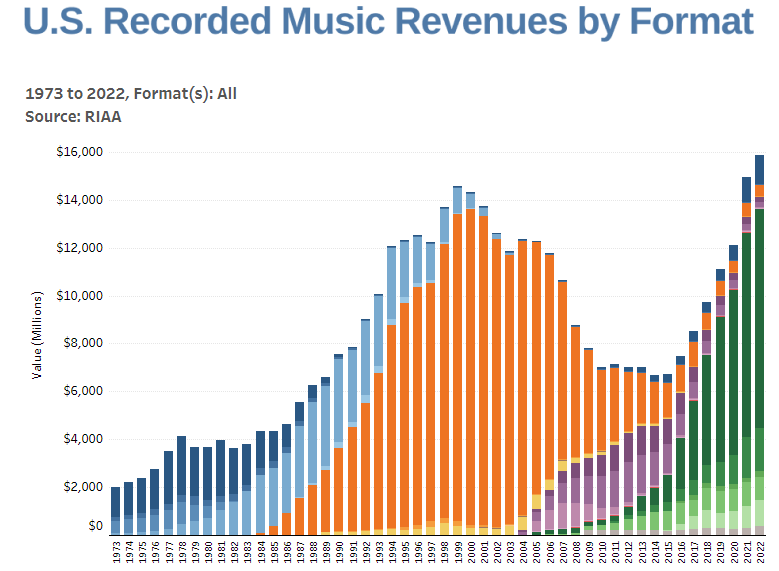
Perhaps the biggest takeaway from this macro view is how much the industry has transformed in the last two decades. At the height of the CD era in 2000, CDs alone accounted for more than 90% of revenues. By 2022 streaming became the most important part of the business, totaling 84% of revenues. No other traditional media format has transformed so much so quickly.
“massive amounts of engagement”
Another trend that emerges from this view is the massive amount of engagement with music that artists and labels have enabled with their fans. In 2022, there were an average of 92 million paid music service subscriptions in the U.S. (to services like Apple Music, Spotify, Amazon Unlimited, Tidal, and others), a more than ten-fold increase in use in less than a decade. And there were an incredible 1.9 trillion music streams in the U.S. in 2022 – an average of nearly 6,000 streams for every American.
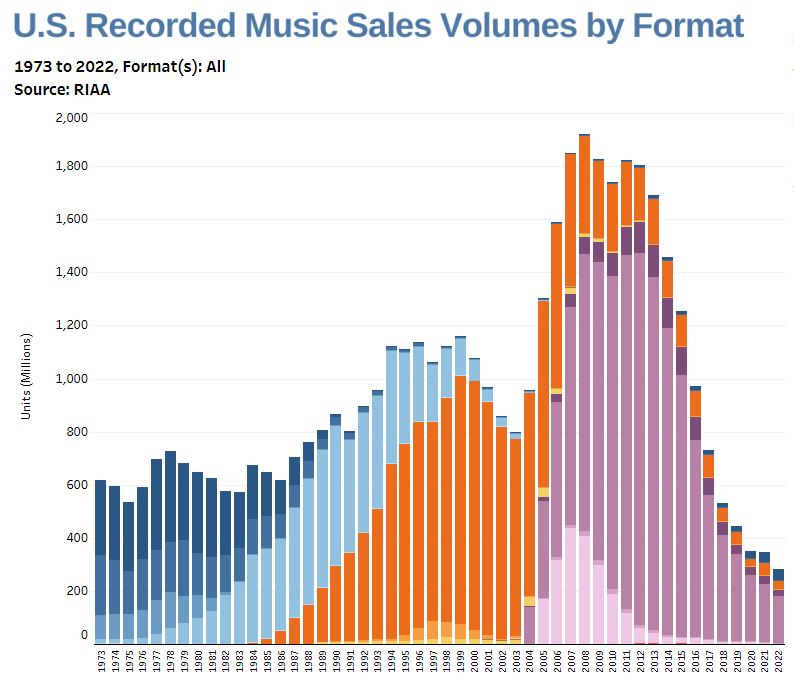
Some of the numbers within these 50 years of available data are truly astonishing. For example, from 1983 through 2022 there were nearly 15 billion CDs (and more than 6 billion cassettes) sold in the U.S. Over an even shorter timeline – since the advent of digital downloads – there were 14 billion downloaded singles, more than a billion digital album downloads and, as a reminder of how even the digital world has transformed, more than two billion ringtones and ringbacks sold. However you want to measure fans listening and purchasing, the connection between artists and their fans is strong – and there’s more music being listened to today than ever before.
Perhaps the most important theme we see in the data is resilience. In the wake of the explosion in digital piracy of the early 2000’s, music revenues fell by more than half by 2014. That meant fewer professional recording artists, fewer jobs in the industry, and challenges to everyone who wanted to see their favorite artists supported. The music business pivoted to new models, transitioning from a sales-based model to one based on “access”. And those investments paid off with more than seven years of meaningful growth – and still growing – resulting in the highest nominal annual revenue figure ($15.9 billion) ever reported in 2022.
Vinyl
Music’s recent growth was the result of not just the newest digital/mobile/social/on-demand ways of listening, but counterintuitively from one of the oldest formats still around: vinyl records. The database tells the story of vinyl’s highs in the 1970’s, decline in the cassette and CD era, and now remarkable renaissance with 16 straight years of growth. Whether it’s for the classic warm sound, vivid artwork, or the sheer collectability of the format, fans have found new connection with their favorite artists and music through this century-old format.
More Data, More Stories
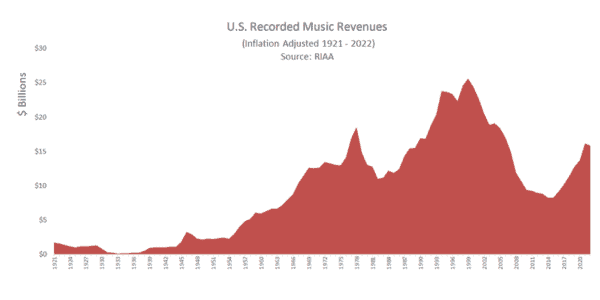
And speaking of centuries, now is a good time to confess that there’s even more data than what’s available in the database. The archived data we have from prior to 1973 is not broken down by format or volume – we just have dollar totals (the inconsistency with newer data is why it is not integrated on the website). Here’s the full set of revenue data as far back as we are able to find – just over a century, with data back to 1921. The impact of the great depression, post war growth, and the effects of music’s cultural explosion in the 1960’s are all visible in this long-term view.
It would be remiss to leave out the contributions of others in telling the story of music, and one of the joys of making this data available has been seeing the interesting things people can do with it. One of our favorites is HERE. In 2020, data.world used this data as the base for a “Makeover Monday” friendly competition to present visualizations of recorded music data. Some of the more interesting results can be found here and here. And people have been creative with animation, which can be seen here and here .
We would be lying if we said we could tell you what was in store for the next 50 years. Continued growth in streaming? Vinyl extending its resurgence? More likely something new we can’t even imagine yet. Whatever it is, we can’t wait to see it and include it.