____________________________
Guest post by Josh Hayes of ChartmetricThe biggest challenge to understanding artist performance is contextualizing different metrics from an incredible number of potential data sources. Many people start their quest to analyze artist performance by gathering as much data as they can. However, they soon find themselves surrounded and overwhelmed by all the data available to them.Our goal at Chartmetric is to push boundaries by strategically utilizing data to empower the music industry, so we set out to find a solution to this problem.The biggest challenge to understanding artist performance is contextualizing different metrics from an incredible number of potential data sources.
Let’s say we want to assess just one artist’s performance. Consider the dizzying number of data sources:
- Music Platforms: Spotify, Apple Music, Youtube, Deezer, iTunes, Soundcloud, LastFM, Songkick, etc.
- Social Media Platforms: Facebook, Instagram, Twitter, Wikipedia, and more.
- Success Measures: Streaming activity, Shazam searches, chart position, active monthly listeners, followers, subscribers, likes, retweets, Wikipedia searches, and fans to name a few.
- Secondary Measures: Growth rates, averages, aggregate statistics, Listener-to-Follower Ratios, weighted Chart summaries — the sky is the limit.
Introducing: CPP Ranks and Scores
The Goal
Chartmetric users have a lot of different analytical needs, and our goal is always to create tools that empower you to do work in your own way rather than dictate or limit your perspective.You know your job better than we do. We know data. Let us empower you to do the amazing work you do.With that in mind, we had the following goals while creating a cross-platform performance measure:- Universality: The measure needs to apply just as well to an artist that is just starting out in the first year of their career as well as for top-artists aiming to grow or extend their established success.
- Flexibility: The measure needs to offer potential insights to analytical projects based in publishing, marketing, sales, A&R, and to creative artists themselves.
- Market Responsiveness: The music world is changing radically. The significance of absolute measures change daily. That 10K increase in your monthly streams could still mean you’re losing market share if the digital market grew radically (which by the way, it is). Scores need to reflect the landscape of the music market today, not yesterday.
- Transparency: If users don’t know how a tool works, then even in the best case they can’t see how useful it is. In the worst case, they won’t trust it. Users need to understand how scores and ranks are calculated. They need to understand why an artist’s values move, whenever they do.

Inspiring Examples:
To understand CPP ranks and scores, let’s look at some examples that illustrate what our users told us they care about. Let’s say we want to compare the career-trajectory of three hypothetical artists that are trying to grow their audiences and revenue. Each artist just experienced a major event in their career:- One artist has had mainstream popularity for over a decade, but has been relatively inactive for a few years. They released a new single and have promo-ed it by performing on a mainstream TV-show.
- The second artist already has two fairly successful albums and now their team is trying a new staggered-release strategy for their next album. They’ve teased a few tracks and announcements on Instagram and Facebook that just culminated in the full album release on Spotify.
- The last artist has a small but dedicated following on Youtube. They just did a Soundcloud collaboration with a Twitch streamer to try to break into the gaming-music scene in order to grow their audience.
- Broadest exposure to audiences: More streams! More views! More retweets! The more audience contact points the better. Each day there is a finite number of eyes and ears out there, and the more of them trained on an artist the better.
- Healthy fan engagement: Just getting streams is not all that matters. You want to absorb some of those new listeners into a reliable fanbase. Loyal followers can be vital to longterm success.
- Success across multiple platforms: Different platforms cater to different audiences, but viral sensations still commonly jump from one platform to another. Having a strong presence on each platform ensures you reach as many people as possible and can also capture viral momentum rather than inhibit it.
- Having longevity with audiences, rather than just being a flash in the pan: Longevity with audiences can have major influences on revenue and/or return on investment. Sadly, some people’s 15-minutes of fame seem to only last 1-minute. While we want to catch viral sensations as they’re happening, the best artists don’t just have a lucky hit and then fade into obscurity. They leverage that hit’s momentum to keep producing, keep engaging, and keep growing.
Calculating Cross-Platform Performance (CPP) Scores
Looking at all possible measures for success, we realized that the most common measures used to assess artists fall into two separate categories:- Stage: This is the amount of “reach” or “exposure” that an artist has over audiences. The bigger the stage, the more people actively listening, watching, or consuming what the artist is creating.
- Followers: This is the size of an artist’s “fanbase” or an artist’s “stickiness” with audiences. Followers have opted into tracking an artist and therefore are more likely to re-engage with the artist’s products in the future. Followers are not actively engaging with an artist all the time, but artists have an easier job of connecting with followers than non-followers.
TL;DR here’s how we calculate the Cross-Platform Performance (CPP) Score:
- Every day, we calculate a single Stage score to encapsulate artist performance across numerous platforms for all of our 1.5 million artists, on a scale from the individual with the biggest stage down (1.0) to the smallest stage (0.0). Then we repeat the process to get each artist’s Followers score on a similar scale (0.0–1.0).
- Now that we know artists’ relative performance in both categories, we take a weighted average of the two that heavily prioritizes Stage overFollowers to find their initial Cross-Platform Performance (CPP) score.
- Next, we apply a number of small bonuses and penalties based on simple, but important, characteristics. For example, it is undeniably better to have a presence on two music platforms rather than just one (regardless of your levels of success on each platform).
- The result? The final Cross-Platform Performance (CPP) Score between 0 and 1. We order each artist by their CPP score and then we order them to get the top 100,000 artists by Rank for each day.
CPP Primary-Component 1: Stage
Stage is the bedrock of assessing artist cross-platform performance in the digital age. It measures how many eyes and ears an artist is reaching at this moment and most accurately responds to the dynamic tastes of the general public.“Stage” captures the extent to which audiences are actively consuming an artist’s work, which connects directly to revenue generation.Most music industry analysts use consumption patterns to inform their business decisions with the most recent, relevant, and insightful information about the market right now. Stage lets you know who is hot right now.Stage is a weighted average of an artists’ reach measured across the following platforms:- Spotify (total monthly listeners)
- YouTube (total views over the past 7 days)
- Wikipedia (average lookups over the past 3 days)
- Twitter (average retweets over the past 3 days)
- Different measures for different platforms. Whether we use total monthly, total weekly, or multiple-day average values is based upon critical assessment of our data sources, gathering schedule limitations, as well as each feature’s behavior, characteristics, and distributions.
- Normalized values within each platform. Today, Spotify monthly listeners range from 0 to 149.6 million while average Wikipedia lookups range from 0 to 292,000. However, being the #1 most popular artist on any platform is going to garner you a lot of industry attention, regardless of the size of the platform. To balance these tensions, we look at the normalized distribution of values for each platform. Essentially we ask “Where do you fall in the pack of Spotify monthly listeners?” and “Where do you fall in the pack of Youtube views?” The answer to both those questions can be easily compared using percentiles.
- Rolling average defends against “flash in the pan” situations while still capturing major shifts of the public eye. By using a 3-day average, we still capture the virality of one-off events, but artists that spike one day and drop the next day will not rise as much as artists that continue to carry public interest. For example, a legacy artist recently passed away and consequently saw a massive (multiple thousand times) increase in Wikipedia lookups–for one day only. We found that the artist’s streams and followers did increase, but not as strongly as one might expect in the middle of their Wikipedia spike. The rolling average more accurately identifies artists’ shifts without over-estimating changes to their Stage.
- We weigh the importance of music platforms multiple times more than non-music platforms. Spotify gets the most weight, Youtube accounts for a slightly smaller part of the score (because Youtube is a mixed platform of music and non-music videos), while Wikipedia and Twitter account for just a small portion of the score.
CPP Primary-Component 2: Followers
There is some general grumbling that goes on about how surprisingly unsupportive “followers” can be. Not every “follower” is a die-hard fan. But some are, and having a vibrant fanbase has been a vital element for growing many artists’ careers. If an artist has a viral hit, but can’t convert any listeners to their fanbase, then that artist will have a very hard time reaching the same market-share of listeners for their next track. Every add to a follower-base is another listener that is easier to reach the next time around. You’d never turn down more followers, right?Correspondingly, the secondary consideration for the CPP Score is followers. Followers is a weighted average of an artists’ fanbase measured across the following platforms:- Spotify (followers)
- YouTube (subscribers)
- Instagram (followers)
- Twitter (followers)
- Deezer (fans)
- Soundcloud (followers)
Turning Stage/Followers into CPP Scores and Ranks
At this point we take a simple weighted average of the Stage and Follower scores to get an initial assessment of the relative performance of every artist across 7 platforms. This value is each artist’s “Initial Score.”Next, we combined industry insights from our users all over the music world to identify a number of simple features that encourage or inhibit artist career success. These alterations aren’t meant to radically shift artists’ scores, but to help draw distinctions between artists that are similar to each other.To match the exponential-logarithmic distribution of most metrics in the music industry (including our initial CPP score), the magnitude of each bonus and penalty is proportional to an artists initial score. Functionally speaking, if one artist has 200K followers and a second artist has 20M followers, and neither artist has much of an Instagram presence, the second artist is failing to utilize more potential revenue generation than the first artist so we penalize the second artist’s CPP score more.Bonuses and Penalties
- Example Bonus — Cross-Platform Presence: Cross-platform presence is increasingly important for top-tier artists. If an artist has a viral break-through on Youtube, inevitably interest spreads and users will attempt to look up the artist on other platforms like Apple Music or Spotify. If users cannot find an artist, they quickly lose interest and move on. Therefore, artists get a small boost for having a presence on each additional platform.
- Example Penalty — Non-Musician: We noticed that some profiles rose to the top that were not who we wanted to showcase in our measure for musicians. For example, the initial run of Stage scores saw profiles like Pewdiepie, European Soccer Clubs, and The Bible performing quite well. Each sees huge success on Youtube, Instagram, as well as having tons of Wikipedia lookups; and as long as they have a Spotify profile, then they flow into our database. To address this, we impose a penalty on entries if their Spotify popularity is low.
- The significance of Bonuses and Penalties are relative to our initial assessment of artist performance. Profiles are given an initial score, then bonuses and penalties are weighted by that initial score, and lastly the initial score, bonuses, and penalties are combined to determine a final score and ranking. What does that mean practically? A musician that is a local act and overall ranked fairly low (37,000th) may still be hit by the low Spotify-popularity penalty but will only lose a small amount of score, because they already started far from the top. If a soccer player released one poorly-received song but also has a massive online presence that got them ranked relatively high (1000th), then the same low Spotify-popularity penalty will be weighted much larger and will shift the profile down much more.

Test-Driving the Cross-Platform Performance metrics:
Let’s do two quick examples to showcase how powerful CPP scores and ranks are to quickly assess artists.Example 1: Artist Performance Over Time (Ranks)
You can use CPP ranks just like you would use any track or artist charts. Ranks give you a simple, direct, way to rank who is performing best. Let’s try an relevant and recent example.The past few months, the music world has been watching Billie Eilish with rapt interest. While she’s been making great music for years, Billie Eilish really exploded onto the scene with the release of her March 29th, 2019 album “WHEN WE ALL FALL ASLEEP, WHERE DO WE GO?”Shortly thereafter, Billie Eilish usurped Ariana Grande for the coveted top position by “Popularity” on the Spotify platform.Can we use the new CPP ranks to visualize how Billie Eilish climbed into the top spots of the music scene, not just on Spotify but across all major platforms? We sure can.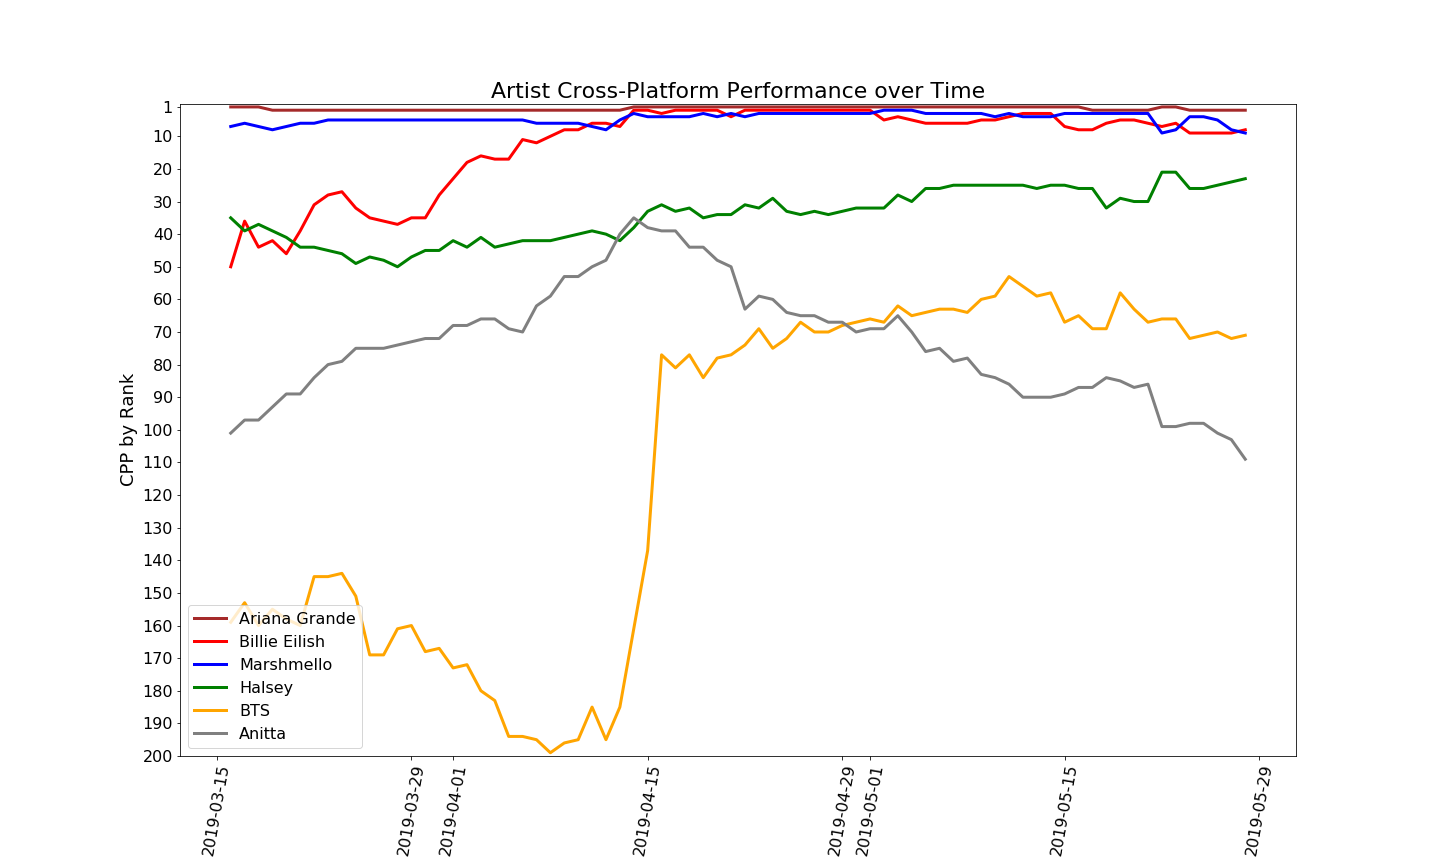
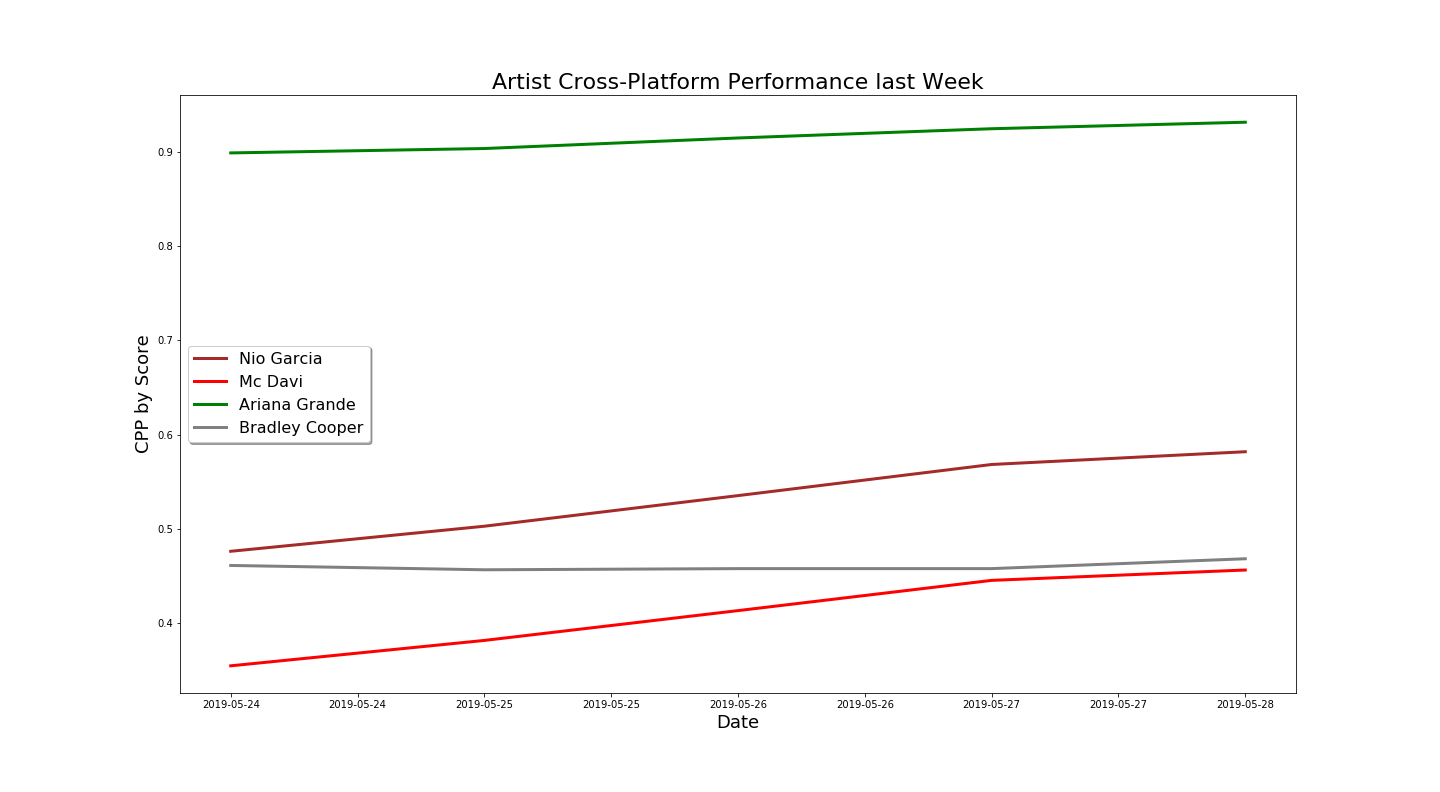
Example 2: Fastest Growing Artists (Measured by Scores)
Let’s track the top 200 artists over the past few days (2019–05–24 to 2019–05–28). Then let’s take the difference between their latest and earliest scores to see who grew the most.That will allow us to rank artists by who had the most growth: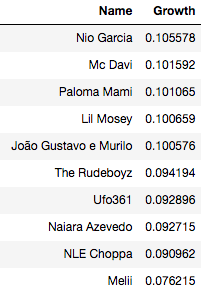
Now you’ve seen CPP Ranks and Scores in Action:
The more data tools in your toolbox, the more empowered you are to choose the best tool for the job.CPP scores and ranks both capture a similar concept, Cross-Platform Performance, with different levels of granularity. If you want a general comparison, ranks are a good way to size up multiple artists. If you want to track your market share over time, scores will be the way to go.We look forward to seeing how our clients utilize the new Cross-Platform Performance metrics to empower their work.In closing, here are some final notes about special cases and model specifics, for the truly algorithm-savvy among you:- Missing Links: If an artist’s external links are inaccurate or we can’t see an artist’s presence on a platform, that tends to hurt them. And… logically speaking, it should right? If an artist has 50k Soundcloud fans (and let’s say the Chartmetric database has no indication they have a Soundcloud presence at all), then the artist should have a higher score than we are giving them. To guarantee that the artists you are assessing have the most accurate values, make sure those artists have up-to-date links for all their off-site connections. We are constantly working on verifying, updating, and cleaning our links but with 1.5 million artists it is a monumental task. We automate it where we can, manually update where we can’t, and encourage crowd-sourcing whenever you stumble upon an error.
- Missing Data: We wake up everyday working to make sure our data is the best in the music industry. But still, on occasion missing data happens. Sometimes we receive missing values for artists even coming directly from music platform APIs. We thought it was important to avoid overly punishing an artist for a temporary data-pipeline error that resulted in missing data. For the CPP Score, missing values translate to that portion of the calculation being nullified. Think like a grade card in school. If your assignment goes missing, instead of giving you a 0, we simply don’t count that assignment towards the total and redistribute the weights across the other assignments to be a 100%. Between our utilization of rolling averages and cross-validating missing entries with past scores, we believe the CPP Score has numerous lines of defense, and is very reliable, even in the face of a rare “data shock.”
- Future Developments: We hope to implement further bonuses and penalties going forward. For example, giving boosts to artists that show hockey-stick growth or penalizing artists with stage-sizes that are stagnating. We want to only add more aspects to the CPP Score if they are defensible, widely embraced, and tested. If you have ideas or feedback, we would love to hear from you.
Do you dig data as much as we do? Let Jason Joven keep you in the loop on the music industry’s latest data gems by tuning into our podcast: Your Daily Data Dump from Chartmetric.Or if you can’t wait to work with Cross-Platform Performance measures yourself, then head over to the Chartmetric website and grab your free account here.Lastly, we’d love to hear from you at hi@chartmetric.io.