
Musician and artist advocate David Lowery shares new streaming data and, apart from showing us what a mature streaming economy looks like, reveals that YouTube, in spite of accounting for more than half of all streams, is only generating 6.4% of all streaming revenue.
By David Lowery from The Trichordist
Here we go with the current year update.
This data set is isolated to the calendar year 2019 and represents a mid-sized indie label with an approximately 350+ album catalog now generating over 1.5b streams annually. Streaming is now a fully mature format, and it is also the number one source of revenue for recorded music. Streaming in all configurations now accounts for 64% of all recorded music revenues. Head on over to the RIAA US sales database [here] to check out the numbers. Pro Tip: Remember to adjust for inflation!
We are keeping a simplified chart again this year. We’ve extended to the top 30 streamers which represent 99.87% of all streaming dollars. The Top 10 streamers account for over 93% of all music streaming revenues (down from 97% last year). The Top 5 account for over 83% of all streaming dollars (down from 88% last year). The drop in overall revenues in the Top 5 and Top 10 are the result of YouTube’s Content ID pulling down the overall revenues / per stream.
The biggest takeaway by far is that YouTube’s Content ID, shows a whopping 51% of all streams generate only 6.4% of revenue. Read that again. This is your value gap. Over 50% of all music streams generate less than 7% of revenue.
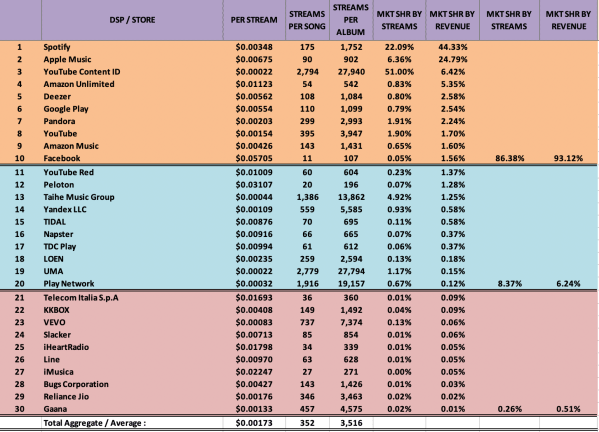
This is the first time we have not seen the Spotify per stream rate drop since the service launched a decade ago. The Spotify per stream rate has stabilized moving up just slightly to .00348 from .00331. In other words Spotify is paying out about $3,300 – $3,500 per million plays. We’re working with a very large sample that has aggregated all streams and revenue against both subscription and ad supported revenues for a single per stream average. This overall average is helpful for anyone who wants to calculate gross revenues by simply looking at the numbers on Spotify itself. For those who may not know, there is a simple “trick” to see the streams of any song on Spotify. On the desktop app, go to the album view and hover your mouse/cursor over the ||||||| at the far right side of any song, just to the right of the song length. Once there the plays for the song will materialize just below the song length.

Using our average, the song above has earned between $4,026 – $4,270.78 (gross before distribution fees) on Spotify at 1,220,224 plays.
Apple Music is again the best value per stream accounting for nearly 25% of all streaming revenue on only 6% of consumption. Spotify generates the most overall revenue of any streamer (no surprise) at 44% of all streaming revenue on 22% of consumption. As stated before, and which can not be overstated enough, You Tube’s Content ID is the major issue limiting growth contributing only 6% of revenues on over half of all streams, at 51% of total consumption. That’s a staggering statistic.
Apple’s per stream rate also stabilizes this year hitting a per stream rate of .0675 which is much closer to where it was two years ago at .00783. Our numbers from 2018 showed a dramatic drop in Apple’s rate at .00495 which we attribute to an expansion into new territories and a large number of 90 day free accounts that had not matured to fully paid subscribers.
In looking at the per stream rates for song and album equivalents, you might want to read this article by Billboard (as of 2018) on the current calculation of how many streams equal an album for the purposes of charting. The report states that, “The Billboard 200 will now include two tiers of on-demand audio streams. TIER 1: paid subscription audio streams (equating 1,250 streams to 1 album unit) and TIER 2: ad-supported audio streams (equating 3,750 streams to 1 album unit).” Our numbers suggest however it would be more fair to average all revenues, against all streams (including content ID), and that actually lands at about 3,516 streams per album across the board.
These numbers are from one set of confidentially supplied data for global sales. If you have access to other data sources that you can share, we’d love to see it.
- HOW WE CALCULATED THE STREAMS PER SONG / ALBUM RATE:
- As streaming services only pay master royalties (to labels) and not publishing, the publishing has to be deducted from the master share to arrive at the comparable cost per song/album.
- $.99 Song is $.70 wholesale after 30% fee. Deduct 1 full stat mechanical at $.091 = $.609 per song.
- Multiply the above by 10x’s and you get the album equivalent of $6.09 per album