____________________________
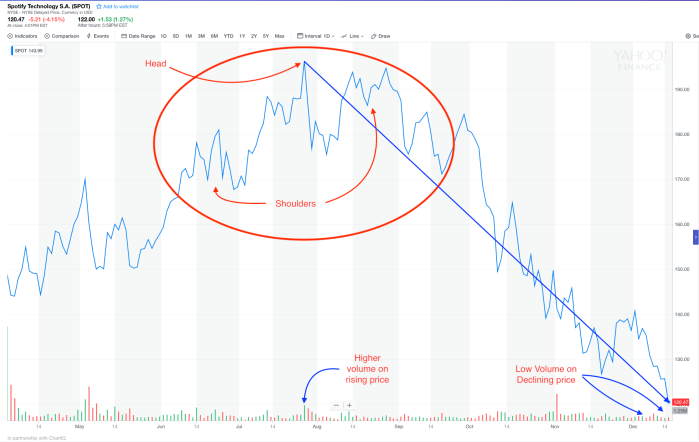
Guest post by Chris Castle of Music Tech SolutionsStocks go up, stocks go down, can’t pick a top and can’t pick a bottom.However–Spotify is a particularly interesting stock for a number of reasons, mostly having to do with the nature of the initial offering. Remember, Spotify did not offer shares in an “initial public offering,” they used an untried method called a “direct public offering.”The difference is crucial. In an IPO, or as its more precisely known, a “full commitment underwriting,” the company (or “issuer”) actually raises money through selling new shares of stock to a group of investors, usually banks. These investors are often called “underwriters”. In the case of a full commitment underwriting IPO, the company sells shares to an underwriting group (or “syndicate“) and the syndicate then sells those shares to the public after the syndicate decides the valuation of the company and the price of the shares of stock.This is completely different from the direct public offering. There are no new shares, there is no syndicate, and the price is set (or was for Spotify) by reference to the price of shares selling in the private market immediately before the public is able to buy–and my bet is that the DPO price was a lot higher than an IPO price would have been. (Dropbox, for example, priced at $21 and closed at $28.48 on its first day of trading. Facebook priced at $38, Google at $85, Alibaba $68, Amazon was $18. Spotify priced at $132 using a loophole from the SEC. And what goes up, must come down.)So, you may ask, if the issuer doesn’t sell shares to an underwriting syndicate, where do the shares come from?The shares come from insiders at the company and any other shareholder, employee, record company, other investors already holding shares who want to get out. All of these insiders have an incentive to keep the share price as high as they can before they get their shares sold to the bigger fool…sorry, I mean to other investors.If you look at the chart, you’ll see some interesting patterns developing. I don’t put a lot of trust in chart analysis, but some people do and it is one of the few things we have to rely on in this case because there is so much insider activity.You’ll notice that there’s something of a “head and shoulders” pattern emerging when the stock reached its high on July 26, 2018 of $196.28. This pattern is often associated with a move to the downside, sometimes a sharp move to the downside.