


By Alessandra Angelini, CEO of Influur
Every time we sit down with a new label, we see the same creator list. Sorted by follower count, the biggest names at the top, the budget split by audience size. It is the fastest list to build. It is also the one our data says has almost nothing to do with whether the song moves.
At Influur, we have run thousands of creator campaigns across music, beauty and consumer brands, in more genres and markets than I can list. This year we went back through every music campaign we have run for labels in the last two years, plus the daily view history of every creator post inside them, and we asked ourselves one question: what actually separates the campaigns that worked from the ones that did not?
Here is what we found, and how we now help labels pick creators and call the result.
The brief does not decide the outcome. The creator does.
We took our best 10% of label campaigns by cost per view and our worst 10%, and compared them line by line.
- Same genres: reggaeton, pop, hip-hop.
- Same markets: Mexico, US Latin.
- Similar budgets.
- Similar creator counts: seven on average versus five.
- Same engagement rate: 7.2% versus 7.7%.
Nothing in the brief separates them. What a view cost differed by more than 20x. The same thing shows up inside every creator tier. Among creators with over a million followers, the cheapest 10% delivered a view for about a dollar per thousand. The most expensive 10% cost over twenty. Mid-size creators, 100,000 to 500,000 followers, showed the same 15x range.
When we ran the numbers, which creator you picked explained 62% of the difference in cost per view. Tier, genre, market and budget combined explained the rest.
Followers and price predict nothing. One number predicts a lot.
Across every creator we have ever paid, the correlation between follower count and views per dollar is zero. Not small, zero.
The number that does predict is simple: views divided by followers. Creators in the top quarter on that ratio delivered reach at roughly a fifth of the cost of creators in the bottom quarter, and it holds inside every tier from micro to mega. A creator whose views run ahead of their followers is being pushed by the platform right now. A creator with two million followers and flat views is coasting on an audience that stopped showing up.
Price surprised us too. The cheapest creators we booked, under $300 a post, were the least efficient band in the whole dataset. The most efficient band was $1,200 to $2,000. Going cheap and going big are the same mistake from opposite directions.
So before we look at size or rate, we look at four signals:
- Views per follower.
- How consistent the views are from post to post.
- How often the creator breaks past their own audience.
- Comments relative to views.
One viral post is not a pattern. Four weeks of steady over-performance is.

+Read more: "If Viral Content Doesn't Drive Streams, Then What Does?"
Match the sound to the creator’s last 20 days
Then we check fit, and we check it the only honest way: by looking at the sounds a creator actually used in the last 20 days, when nobody was paying them. Most creators circle two or three genres. If someone posted country four times and pop twice this month, and you pay them to post a drill track, their audience feels the seam immediately. So does the algorithm.
We also tell labels not to hand creators a script. Creators know their audience better than anyone at the label, including me. Give them the song, the moment in the song that matters, and the budget.
One campaign we ran was briefed for lifestyle creators in a single lane. The posts that drove the most views on the sound came from moms filming with their kids. We saw it in real time and moved the budget toward them. If you cannot see that while the campaign is live, you are guessing with money attached.
"Across every post we have tracked, 1% of posts carry 41% of all views. 10% carry 75%. At the campaign level, the top 10% of campaigns produce half of all views."
The result is always a handful of posts
Across every post we have tracked, 1% of posts carry 41% of all views. 10% carry 75%. At the campaign level, the top 10% of campaigns produce half of all views.
This is why we push back when a team wants to put a whole budget on two names. The most efficient campaigns in our data ran six to ten creators. You need enough shots for the outlier to show up, and you need to be watching so you can feed it when it does.
How to know if it worked
Three things from the data. First, the clock. A creator post has 16% of its final views on day one, 74% by day two, 91% by day seven and 97% by day 14. By day 21 it is done. Judge the campaign on day 14. And notice that day two already tells you three quarters of the story, which is exactly when the budget should be moving.
Second, reach and resonance are different purchases. At the campaign level, engagement rate has no correlation with views per dollar. At the post level the correlation turns negative: the posts that travel farthest engage least, because the platform carried them to strangers. We tested four definitions of viral across every post in our history. Exactly one post met all four. Of the posts that went viral on views, 7.5% also went viral on engagement. Decide before launch whether you are buying awareness or a community reaction. The same creator list rarely does both.
Third, listening. Views are the floor. The real test is whether attention turned into streams, saves and Shazams in the two weeks after the posts, and how much new content used the audio without being paid.
Earlier this year we worked on a debut single from the independent label Thirty Knots, “Self Aware” by Temper City: 17 creators, a $5,100 budget, no big names, 30.7 million organic views at a $0.17 CPM. The song went on to the Billboard Hot 100, No. 1 on Spotify’s Global Viral chart and past 150 million Spotify streams. The campaign lit the fuse. The song did the rest, and anyone who tells you a creator push can do more than that is selling something.
+Read more: "What Happens After the Streams Stop: How Independent Artists Should Measure a Campaign"
Where this is going
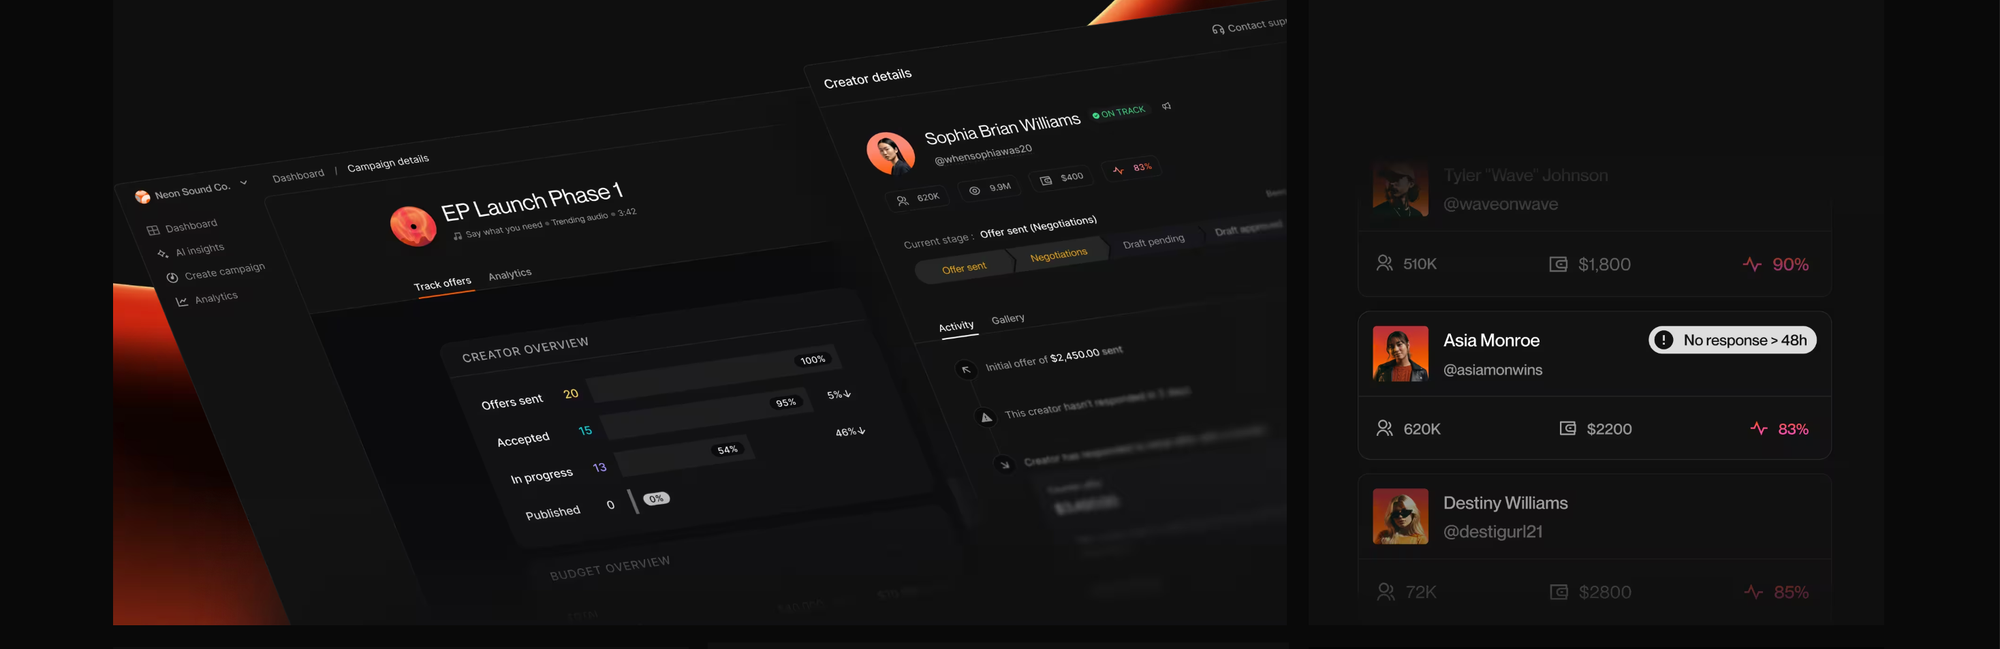
Everything above used to take a team weeks: pulling a creator’s last 20 days by hand, checking views against followers, watching the dashboard on day two and re-cutting the budget. That is why we built Influur Pulse. You upload the track, set the budget, and the agent builds the list from these signals, flags the hidden creators the platform is pushing right now, and shows you by day two where the money should go. Four minutes instead of 48 hours.
The teams winning right now can see which creator is moving the song by Tuesday and move money by Wednesday. Follower counts and big names on the list matter far less than that. Speed is the whole advantage, and it belongs to whoever has the data first.
Alessandra Angelini is the Co-Founder and CEO of Influur, the influencer marketing platform behind Influur Pulse, the AI agent for music virality. She is a former CNN journalist and a Forbes 30 Under 30 honoree.

